
XCore HFT / Trading Lab
PULSE: DMA gives control and responsibility
Quantitative execution, market-microstructure, and risk-control research from XTRSK.
What this problem really is
Direct market access (DMA) removes the traditional broker‑dealer screen that sits between a proprietary strategy and the exchange order‑book. The immediate benefit is a reduction in round‑trip latency and the ability to place orders at the exact moment a signal is generated. The hidden cost, however, is that the firm now carries the operational responsibilities that the broker once performed. Every element of the order – the ticker, the buy or sell side, the quoted price, the quantity and the account identifier – must be verified by the firm before the message is released to the venue. If any of those fields are malformed, the order can be rejected, or worse, executed at an unintended price, creating a direct loss.
The responsibility does not stop at syntactic validation. Modern regulatory frameworks and internal risk policies demand that the order be screened for fat‑finger errors, notional limits, frequency caps and duplicate submissions. Those checks must be performed in microseconds, otherwise the latency advantage of DMA evaporates. The firm therefore needs a deterministic, pre‑trade control stack that can keep pace with the strategy’s tick‑rate while still providing a safety net against human or algorithmic mistakes.
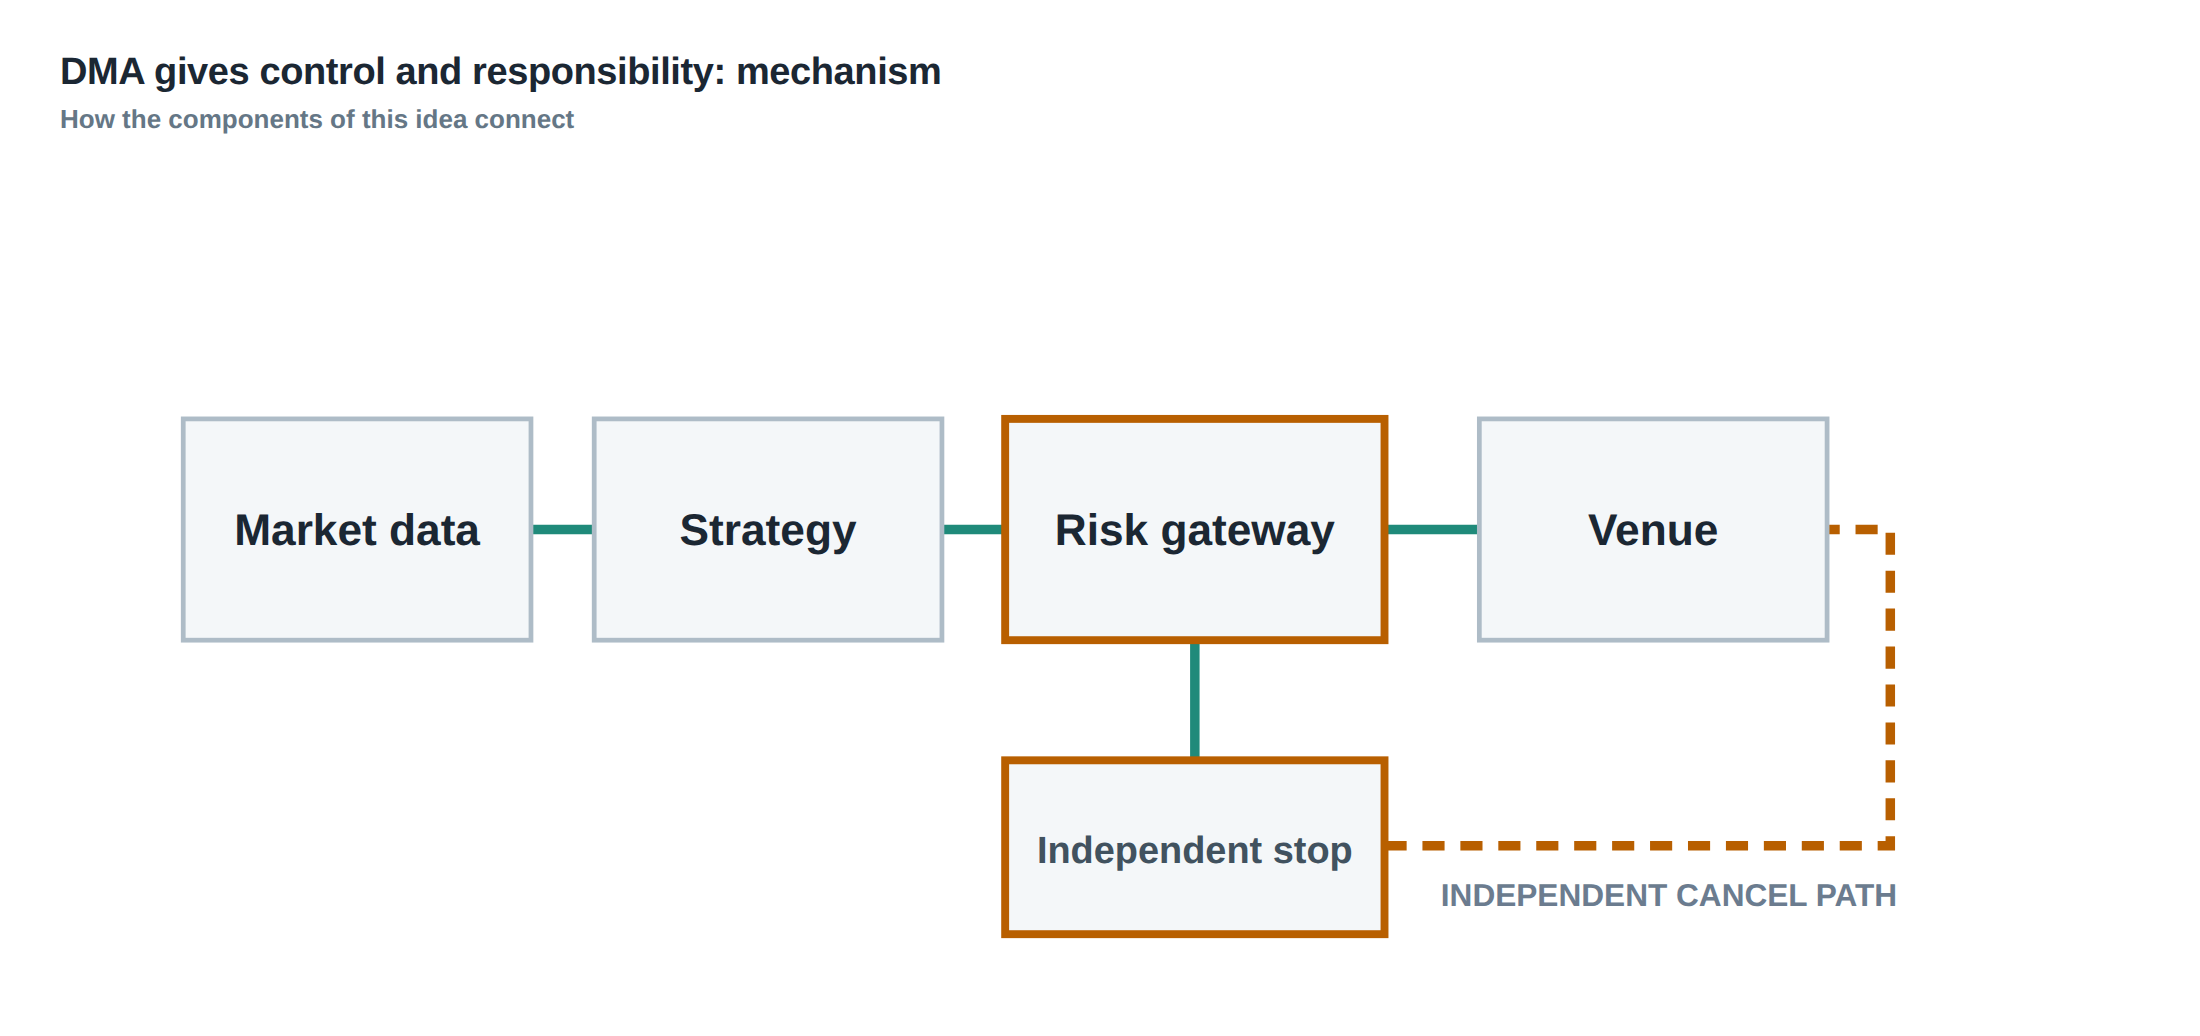
A further, often overlooked, requirement is a “kill path” that is independent of the strategy’s own process. If the strategy hangs, the market data feed stalls, or a downstream gateway crashes, the firm must be able to withdraw all outstanding orders instantly. That path must be exercised in production, logged, and verified daily; otherwise the apparent speed advantage of DMA becomes a single‑point failure risk.
How the mechanism works, step by step
When a strategy decides to trade, it first builds an order object in memory. The object contains the instrument identifier (for example, EUR/USD spot), the side (buy or sell), the limit price, the desired quantity, and the internal account tag that will receive the trade. The first stage of the DMA pipeline is a deterministic validator that checks each field against a static reference – a symbol table that maps the internal ticker to the exchange’s MIC code, a price‑tick table that enforces the minimum price increment, and a quantity‑step table that ensures the order size respects the market’s lot size.
If the validator passes, the order is handed to the pre‑trade risk engine. The engine calculates the order’s notional value, compares it against the firm‑wide and desk‑specific exposure limits, and evaluates the order against frequency controls that limit the number of submissions per second for a given symbol. It also runs a duplicate‑order detector that hashes the order’s key fields and checks them against a short‑term cache. Only when the risk engine returns a clean bill of health does the order proceed to the gateway, where it is encoded in the exchange‑specific protocol (FIX, OUCH, or native binary) and transmitted over a low‑latency fibre or microwave link.
On the exchange side, the order is placed into a price‑time‑priority queue. The exchange immediately sends an acknowledgement (ACK) back to the gateway, which must be correlated with the original order ID. Subsequent messages – fills, partial fills, cancellations, or rejects – are streamed back to the firm’s post‑trade reconciler. The reconciler must match every inbound message to an outbound request, flag any mismatches, and raise an alert if an order disappears without a final status.
A worked example with real numbers
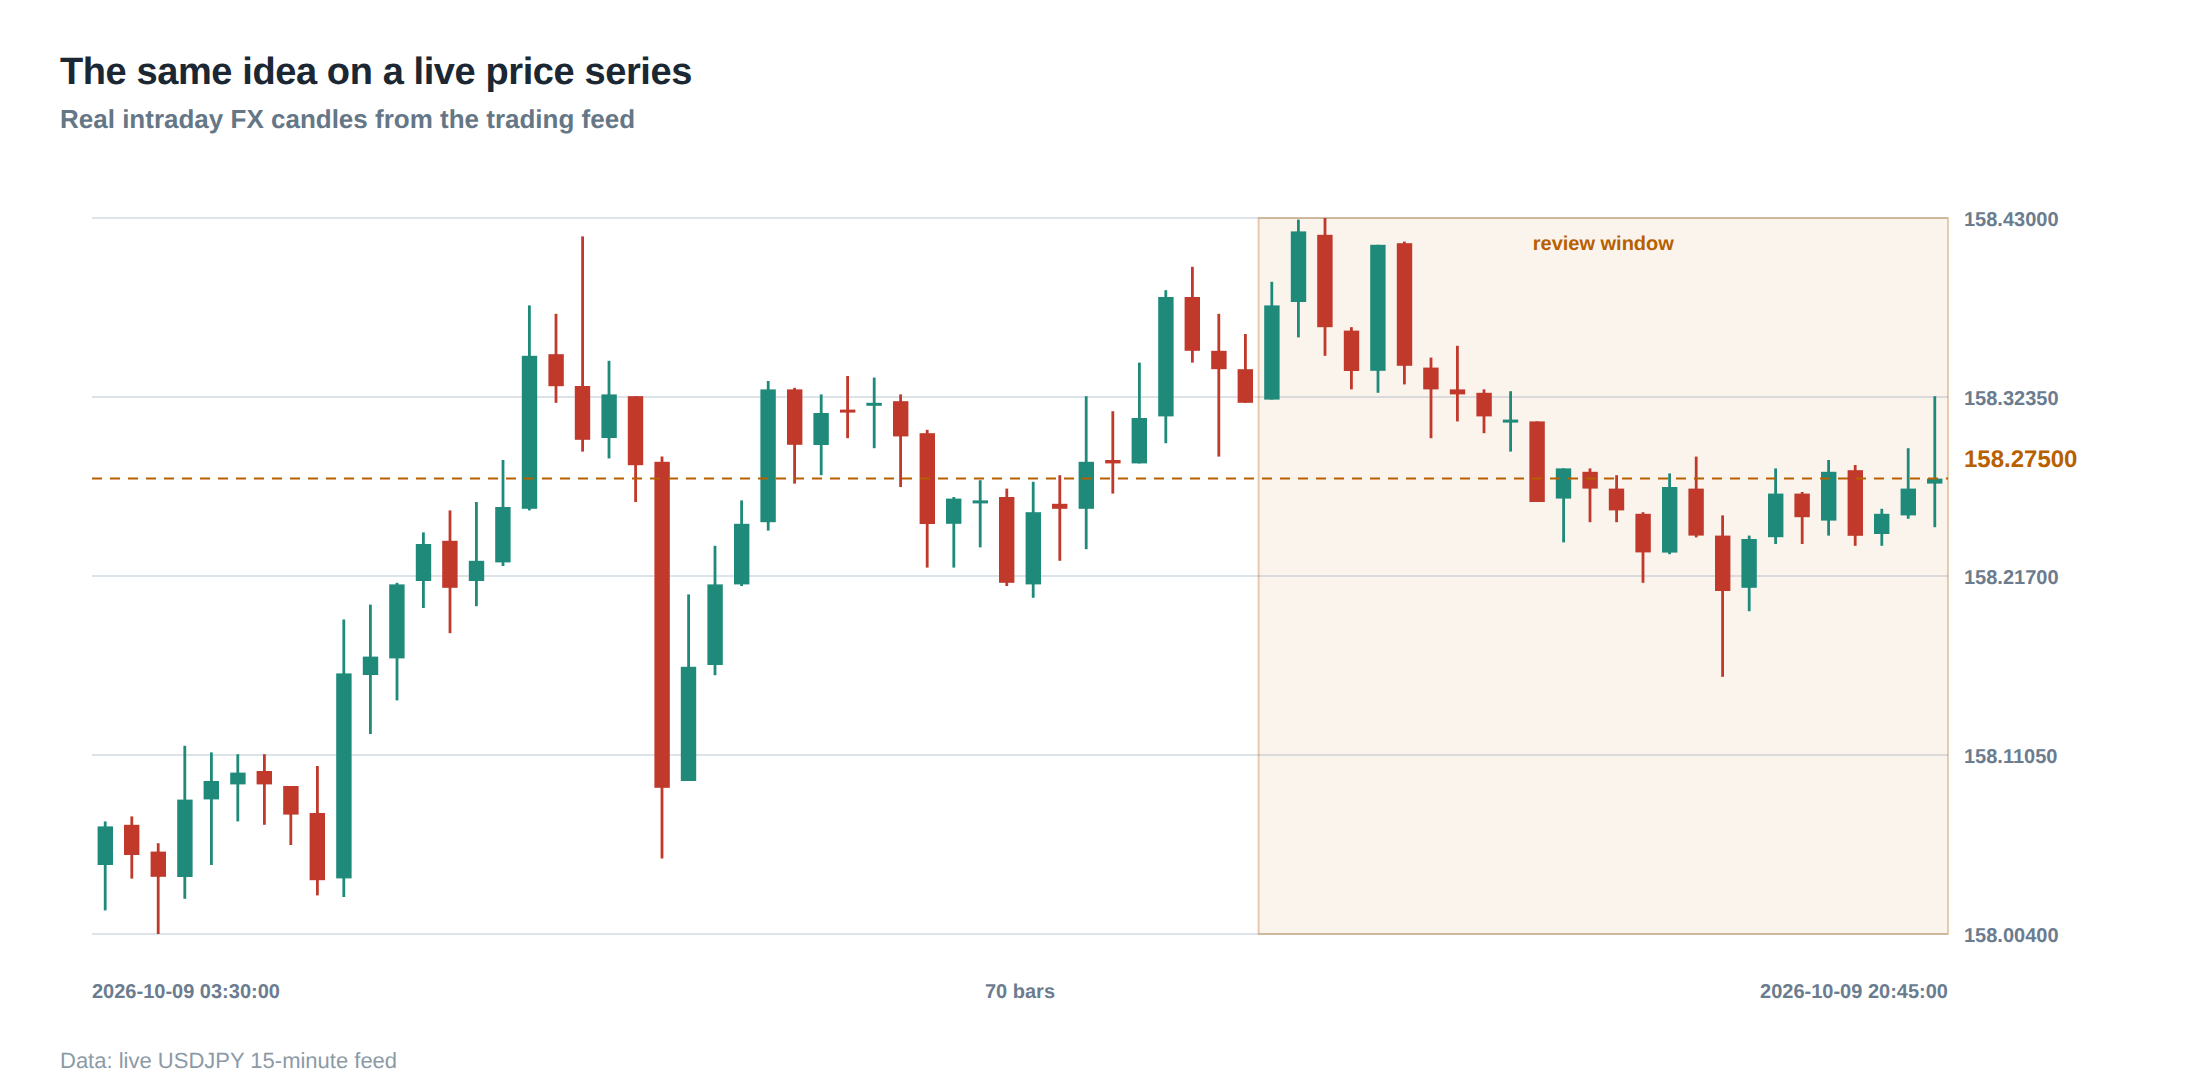
Consider a statistical arbitrage strategy that monitors the EUR/USD 1‑minute candle. At 09:30:12.345 UTC the model identifies a mispricing and decides to buy 1 000 units at a limit price of 1.2345. The internal account code is “FX‑ARB‑01”. The validator checks that “EURUSD” maps to MIC “XPAR”, that the price tick is 0.0001, and that the quantity step is 1 000, all of which pass. The risk engine then calculates the notional: 1 000 × 1.2345 = 1 234 500 USD. The desk’s per‑trade notional cap is 2 million USD, so the order is under the limit. Frequency controls allow up to five orders per second for EUR/USD; this is the third order in the current second, so it passes. The duplicate detector sees that no identical order has been submitted in the last 500 ms.
The order is encoded in FIX 4.4, transmitted via the low‑latency gateway, and reaches the exchange in 0.78 ms. The exchange places it at the back of the 1.2345 bid queue. An ACK is received at 09:30:12.347 UTC and logged. Two milliseconds later, a competing market participant lifts the price to 1.2346, and the order is partially filled for 500 units at 1.2345. The fill message is reconciled, the position updated, and the remaining 500‑unit leg stays in the queue.
If the fat‑finger check had been omitted, a typo could have produced a price of 12.3450, resulting in an immediate market‑order execution of a 1 000‑unit trade at the prevailing market price of 1.2350, a notional of 1 235 000 USD but at a price 10 times higher than intended. The kill path, exercised manually by the risk operator, would have sent a bulk cancel request that cleared the remaining 500 units within 1 ms, limiting the loss to the half‑filled leg.
Where it breaks in live markets
Even with a perfect validation stack, the live market environment introduces failure modes that are difficult to anticipate. Network congestion can add several milliseconds of jitter, causing the order to arrive after the price has moved, turning a limit order into a marketable order. Gateway software bugs may corrupt the FIX tag that carries the account identifier, leading to the order being booked to the wrong ledger and triggering a post‑trade reconciliation exception.
Human error remains a potent source of risk. An operator may inadvertently disable a frequency limit while performing a system upgrade, allowing a runaway algorithm to flood the market with orders. In high‑frequency environments, a single mis‑routed order can generate a cascade of self‑trading, especially when the strategy relies on the order’s position in the queue to capture spread. Finally, the “kill path” itself can be compromised: if the independent cancellation service shares a single point of failure with the order gateway, a network outage can prevent the firm from withdrawing all open orders, leaving the firm exposed to adverse price moves.
The operating path, stage by stage
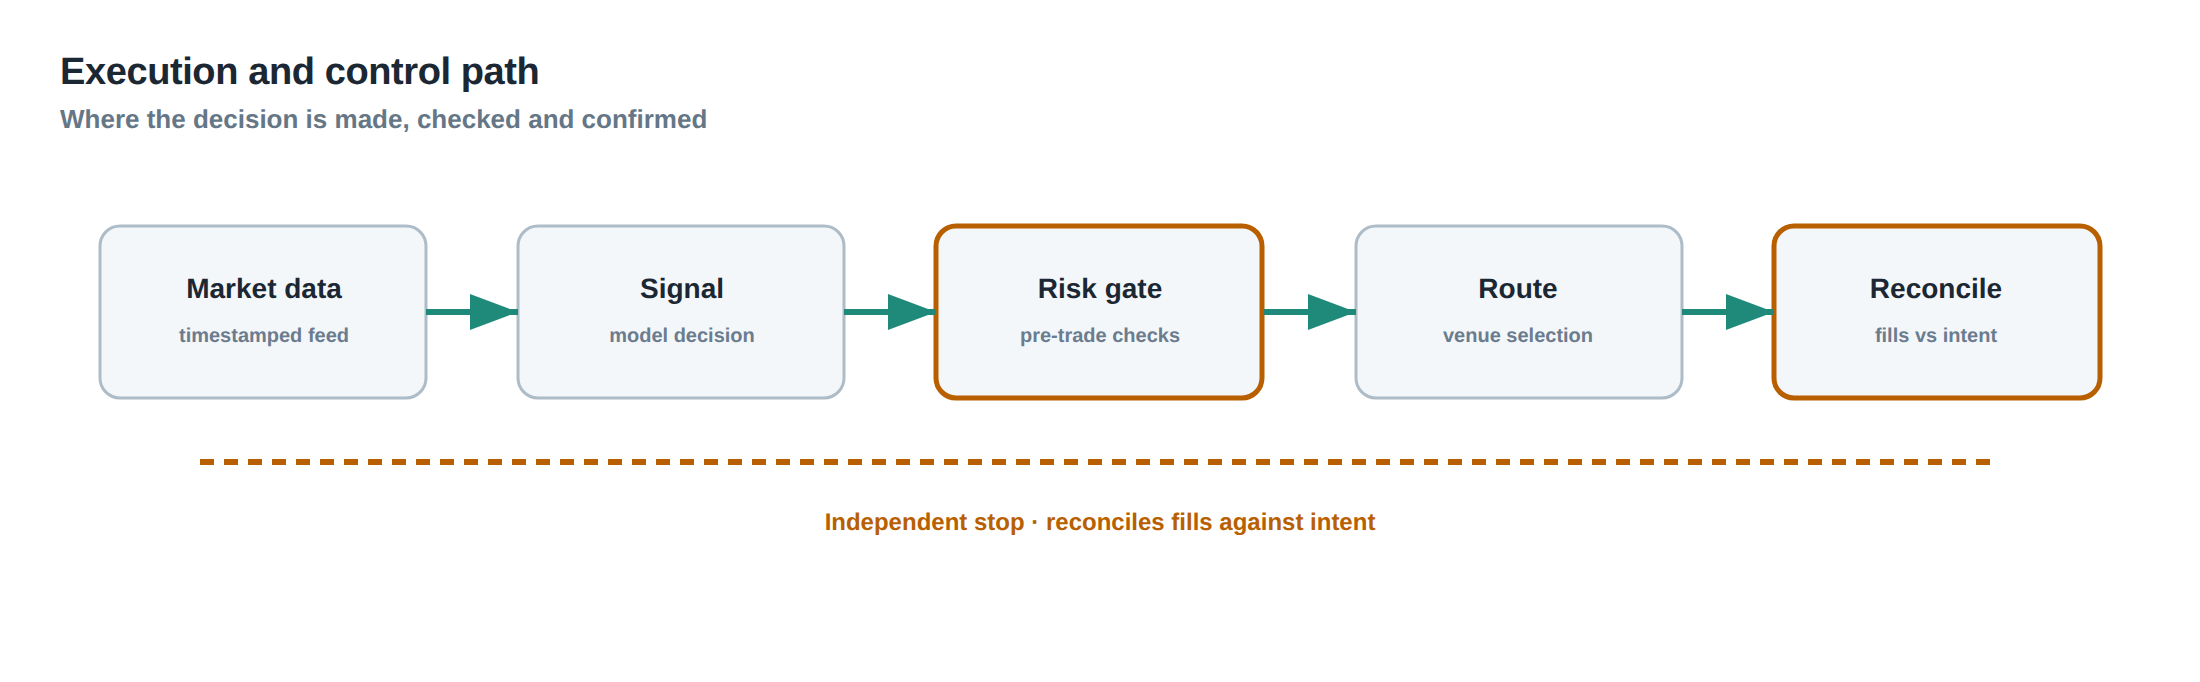
The DMA pipeline can be decomposed into five deterministic stages. The first stage – intake – receives the raw signal from the strategy and creates a canonical order object. The second stage – validation – checks symbol mapping, price tick, quantity step and account existence against static reference data that is refreshed nightly. The third stage – risk – runs the notional, exposure, frequency and duplicate checks, returning a binary pass/fail decision. The fourth stage – routing – selects the optimal gateway based on latency, cost and venue availability, encodes the order, and transmits it over a dedicated line. The fifth stage – post‑trade – ingests acknowledgements, fills, cancels and rejects, matches them to the original order IDs, and updates the position book.
Each stage must be instrumented with precise timestamps, error codes and health‑checks. The timestamps allow the firm to compute end‑to‑end latency and to identify bottlenecks. Error codes enable automated alerts that can trigger a pre‑defined escalation workflow. Health‑checks – such as “validation latency < 100 µs” or “risk engine CPU utilisation < 70 %” – are polled every second, and any breach forces the kill path to be activated.
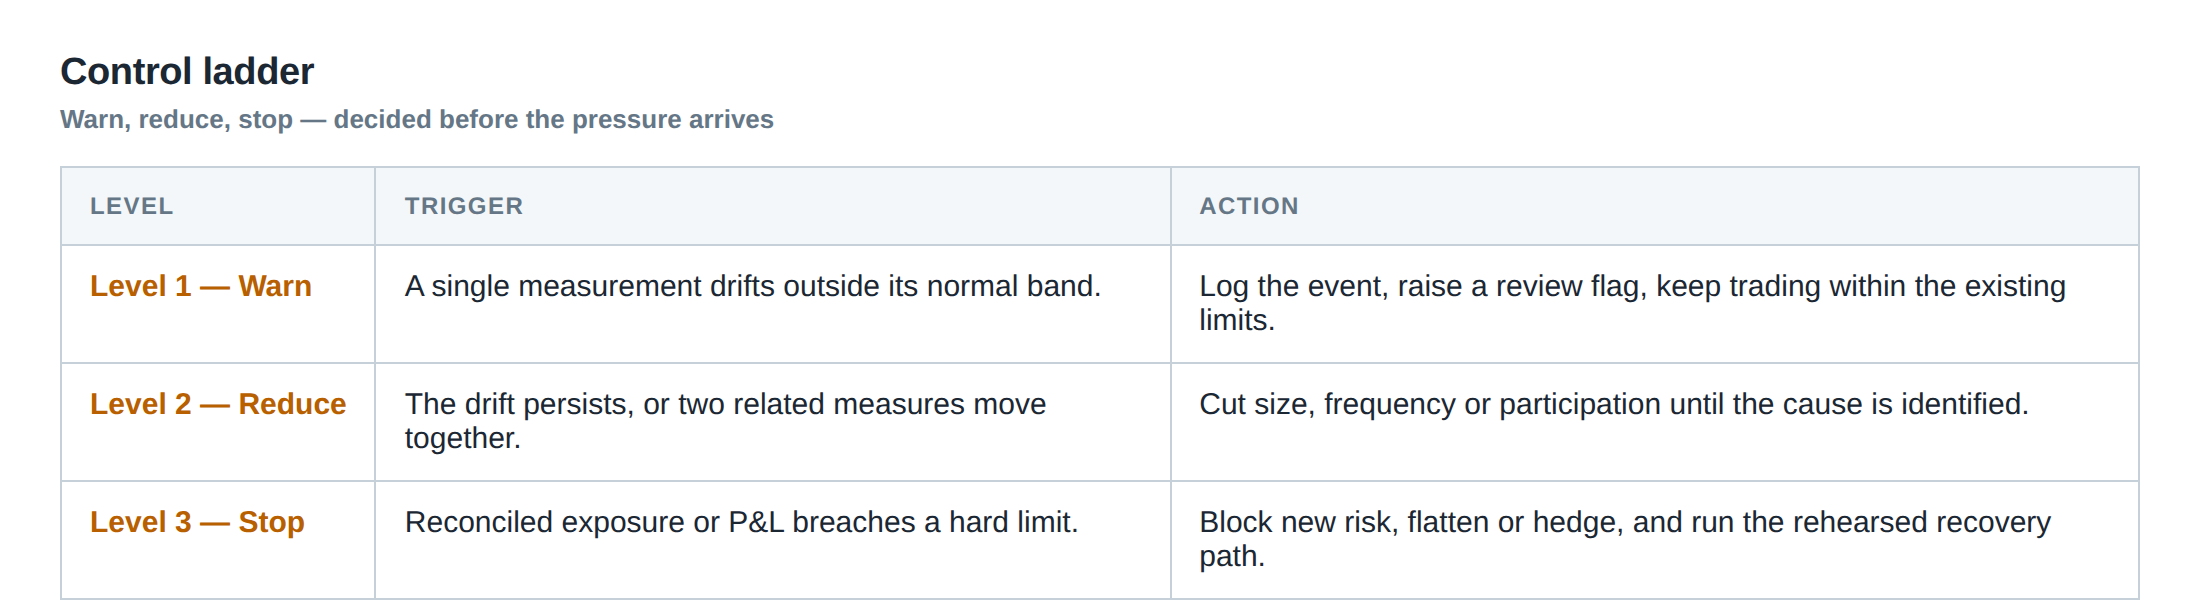
Controls that act before the damage
The first line of defence is the fat‑finger filter, which enforces a maximum price deviation from the mid‑quote – for example, no order may be submitted more than 5 ticks away from the best bid or ask. The notional guard caps the dollar value of any single order and also enforces a rolling‑window exposure limit per instrument, preventing the desk from accumulating an outsized position in a volatile market. Frequency limits are implemented as a token bucket that refills each second, ensuring that even a misbehaving algorithm cannot exceed a preset order‑per‑second threshold.
Duplicate detection uses a hash of the order’s key fields and a short‑term in‑memory store; if an identical hash appears within a configurable window (typically 200 ms), the second order is rejected. A separate supervisory layer monitors the output of the pre‑trade stack in real time, applying statistical anomaly detection to flag spikes in order‑size, price deviation or submission rate that may indicate a software bug or a data‑feed glitch. When any of these controls raise an exception, the order is automatically cancelled and a detailed audit record is written to an immutable log.
How to measure whether it is working
Effectiveness is quantified by three core metrics. The false‑positive rate measures how often a legitimate order is blocked by a control; a high rate indicates over‑constraining parameters that may erode the strategy’s edge. The kill‑path activation latency records the time from a control breach to the issuance of a bulk cancel; industry best practice is under 2 ms. Finally, the reconciliation mismatch ratio tracks the proportion of inbound execution messages that cannot be matched to an outbound order; a persistent mismatch suggests gaps in the acknowledgment‑tracking logic.
These metrics are collected continuously, aggregated per trading day, and plotted on a control‑performance dashboard. Trend analysis highlights drift in market conditions – for example, widening spreads may cause the fat‑finger filter to reject a higher proportion of orders, prompting a parameter review. Periodic stress tests, where synthetic bursts of orders are injected, verify that the system can sustain peak loads without exceeding the latency budgets.
The portfolio view
From a portfolio perspective, the pre‑trade controls act as a friction layer that shapes the realised risk‑adjusted return. Each rejected order represents an opportunity cost; aggregating those costs across the desk provides a “control‑drag” figure that can be compared against the reduction in tail‑risk achieved by the same controls. The firm’s risk‑management system should therefore ingest control‑event logs alongside P&L data, attributing profit and loss variance to specific control breaches or kill‑path activations.
A holistic view also incorporates the capital tied up in orders that remain alive in the queue. By modelling the expected time‑in‑queue and the probability of adverse selection, the desk can estimate the opportunity cost of each standing order and decide whether tighter frequency limits would improve capital utilisation. The final portfolio analysis thus balances three competing objectives: speed of execution, robustness of operational safeguards, and efficient capital deployment.
Is your current DMA stack calibrated to protect against operational slip while preserving the speed advantage your strategies depend on?
About the research behind this lesson
The seminar frames electronic markets as price-time-priority queues. It separates queue value into spread capture versus adverse-selection cost and the option value of retaining a place in line.
Applied to this lesson: An order lifetime therefore cannot be based on elapsed time alone: the system must reassess whether its queue position, expected spread and adverse-selection risk still justify keeping the order alive.
Explore PULSE: System details
PULSE live account: Verify the live account on FX Blue
Live chat and updates: Telegram @xtrskhft
Source: High-Frequency Trading and Modern Market Microstructure
Educational content only. Trading leveraged products involves risk.
Chat with XTRSK
Chat ready
Start a chat and the XTRSK team will be notified immediately.