
XCore HFT / Trading Lab
PULSE: Pre-trade risk should be layered
Quantitative execution, market-microstructure, and risk-control research from XTRSK.
What this problem really is
In electronic execution the moment an order leaves the strategy’s code it becomes a mutable object that lives inside a price‑time‑priority queue. The queue is not a static container; its value is the sum of two competing components. The first is the spread capture that the order can earn by sitting at the front of the line. The second is the adverse‑selection cost that accrues the longer the order remains exposed to informed flow. A third, often overlooked, component is the option‑like value of retaining a place in line – the right, not the obligation, to trade at a future price. When a desk imposes a single hard threshold – for example a maximum order size – it assumes that any order that respects that threshold will never threaten the portfolio. In practice the queue’s value is a function of market depth, volatility, and the existing exposure of the portfolio. An order that passes a size check can still be dangerous if the portfolio’s risk budget has already been exhausted by correlated positions. The problem, therefore, is not a lack of limits but a lack of layered, context‑aware pre‑trade checks that evaluate an order against the current state of the queue, the market, and the firm‑wide risk envelope.
How the mechanism works, step by step
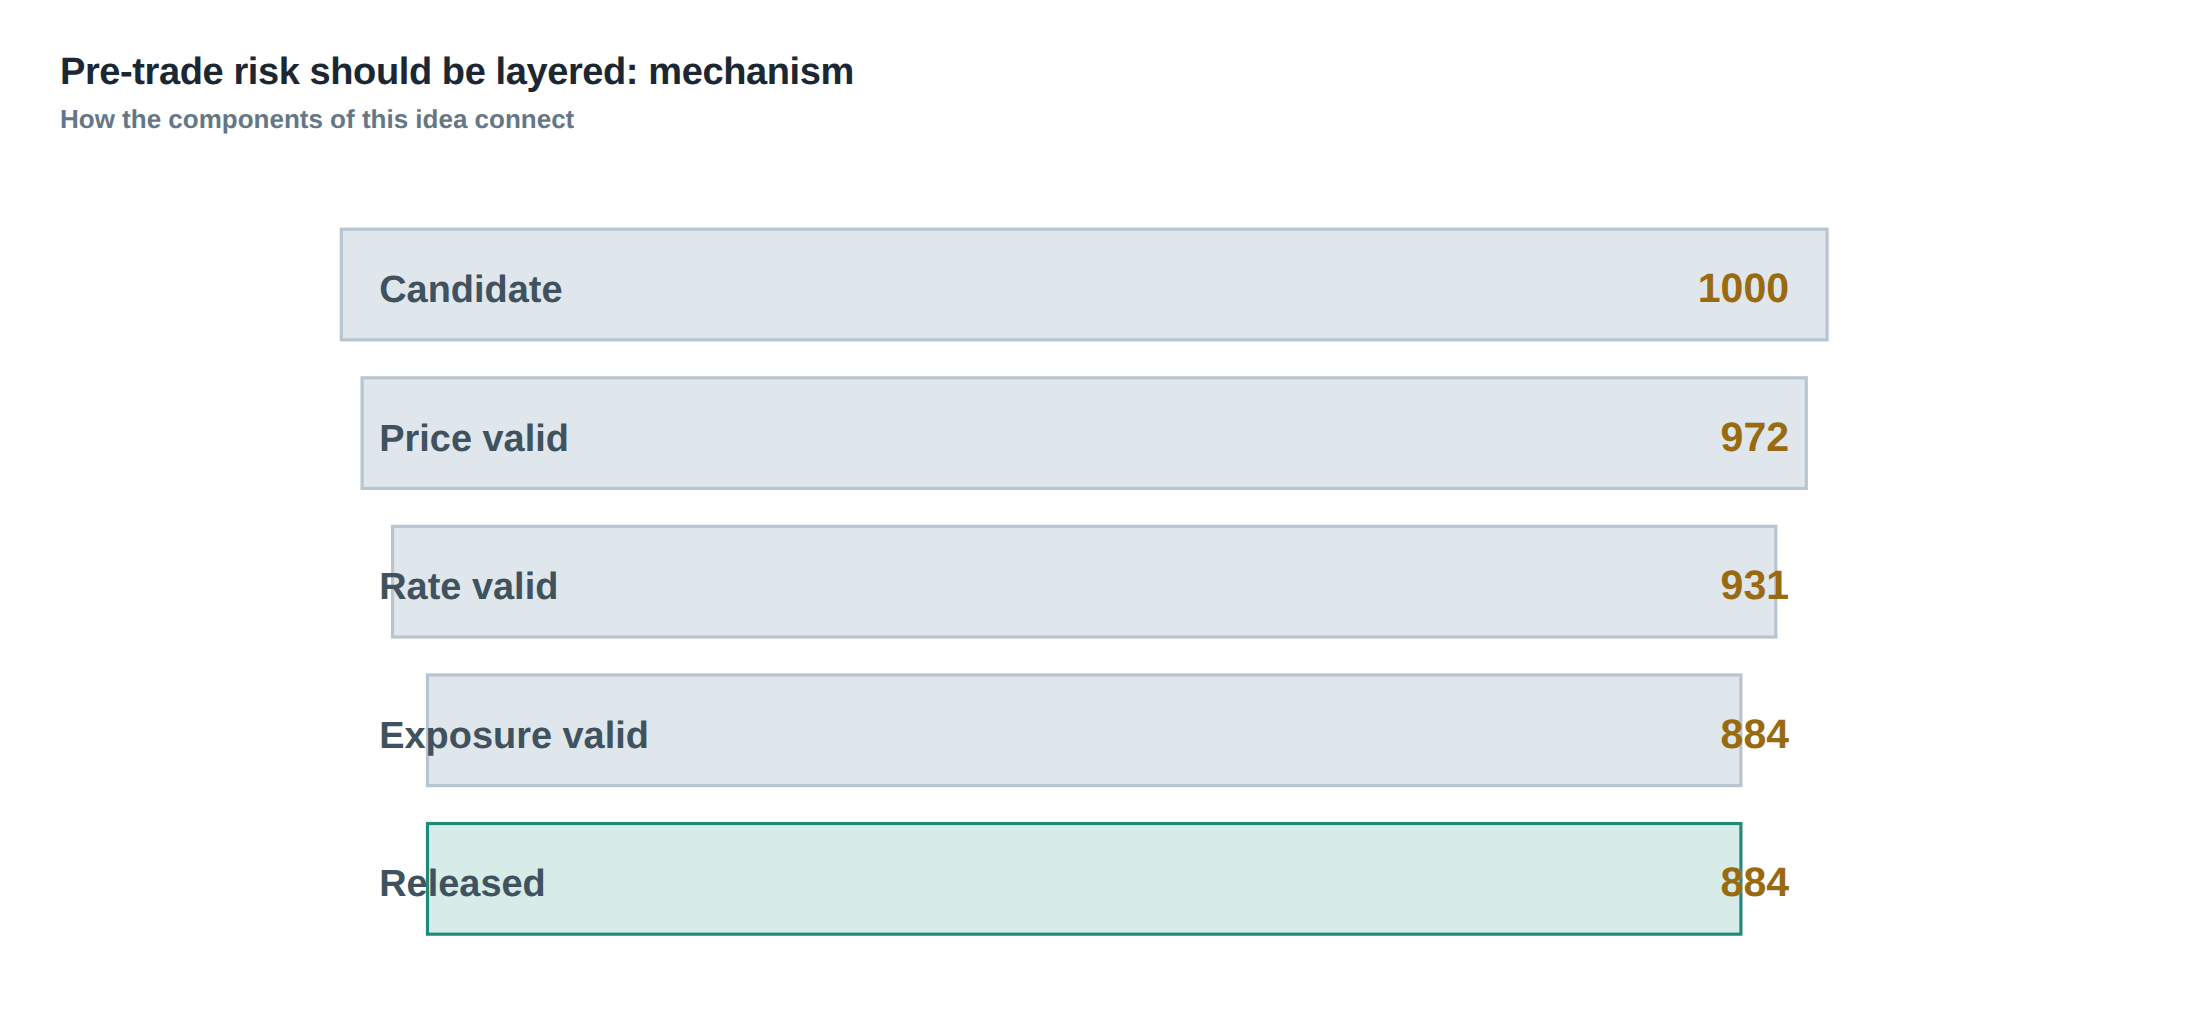
The first gate examines the raw order parameters – quantity, notional value and the distance from the prevailing mid‑price. The system rejects any request that exceeds the per‑instrument maximum quantity or that would push the order more than a pre‑defined number of ticks away from the best price, because such orders are likely to be filled at unfavourable levels. The second gate monitors the rate of order messages. If a strategy repeatedly submits, amends or cancels orders faster than a configured frequency, the gate flags the activity as a potential runaway algorithm or a connectivity glitch. The third gate aggregates exposure at four hierarchical levels: the individual strategy, the instrument, the account and the firm. Each level has a hard ceiling and a soft utilisation band; once the soft band is breached the gate raises a warning, and if the hard ceiling is reached the order is rejected outright. The fourth gate validates the timeliness of the market data that underpins the signal. If the price feed timestamp is older than a configurable latency window, the order is rejected as stale. Finally, every rejection is logged with a unique identifier and broadcast to the operations dashboard, ensuring that the failure mode is observable and can be acted upon in real time.
A worked example with real numbers
Consider a statistical arbitrage strategy that trades the EUR/USD‑GBP/USD pair. The strategy’s per‑trade size limit is set to 1 million EUR, and the notional cap per instrument is €10 million. At 09:32:15 the strategy generates a signal to buy EUR/USD at 1.0895, with a target quantity of 800 000 EUR and a price limit of 2 ticks (0.0002) away from the mid‑price of 1.0893. The order passes the first gate because 800 k < 1 M and the limit price 1.0895 is within the 2‑tick band.
The message‑frequency gate sees that the strategy has already submitted three orders in the previous second, which is below the threshold of five per second, so it proceeds.
Next, the exposure aggregation gate evaluates the current portfolio. The strategy already holds a long EUR/USD position of 7 million EUR and a short GBP/USD position that, when converted, adds an effective EUR exposure of 3 million. The firm‑wide EUR exposure limit is set at 9 million EUR, with a soft utilisation band at 8 million. Adding the new 800 k would push the total to 10 800 k, breaching both the soft band and the hard ceiling. Consequently the order is rejected, even though it satisfied the individual size and price checks.
Finally, the data‑freshness gate confirms that the market snapshot used to generate the signal is less than 20 ms old, well within the 50 ms latency window, so no additional rejection occurs. The system returns a rejection code “EXPOSURE_LIMIT_EXCEEDED” and the operation team sees the event immediately on the dashboard.
Where it breaks in live markets
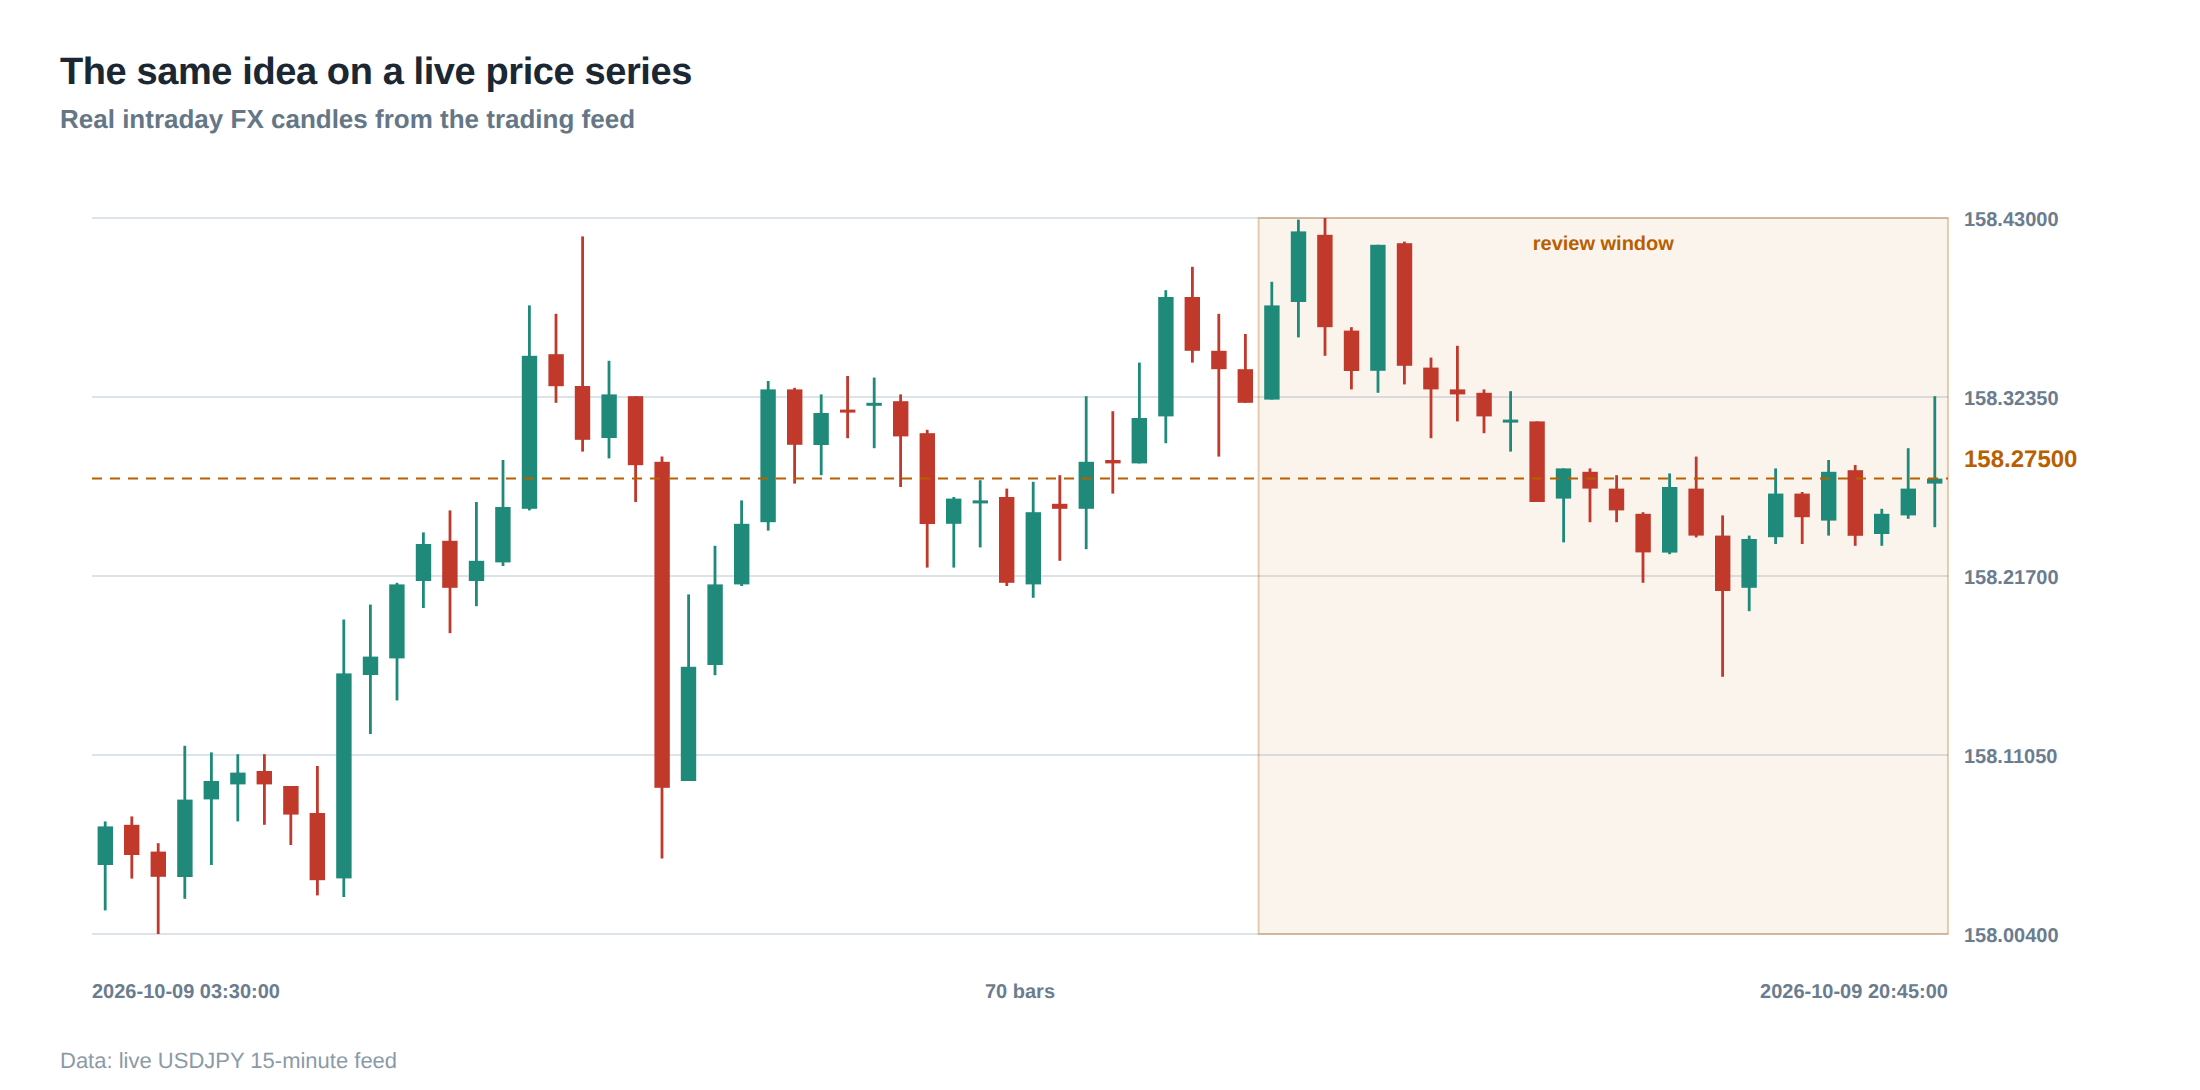
In a high‑frequency environment the assumptions that underlie a single‑threshold system crumble quickly. Market depth can evaporate in milliseconds during news releases, turning a previously safe 2‑tick limit into a deep‑loss scenario. Moreover, correlated positions that sit on the same risk factor may be spread across many strategies, instruments and desks; a single strategy’s view of its own exposure is therefore blind to the aggregate load. When a firm‑wide risk engine updates only every few seconds, an order that passes the per‑instrument check can be submitted just after the engine’s last refresh, leaving a window where the portfolio is temporarily over‑leveraged. Connectivity glitches exacerbate the problem: a stale data feed may report a mid‑price that is already obsolete, causing the price‑distance gate to approve an order that will be executed at a price far outside the intended band. Finally, message‑frequency throttles can be circumvented by splitting a large order into many small fragments; each fragment passes the size gate, but the cumulative effect is a large, unintended market impact.
The operating path, stage by stage
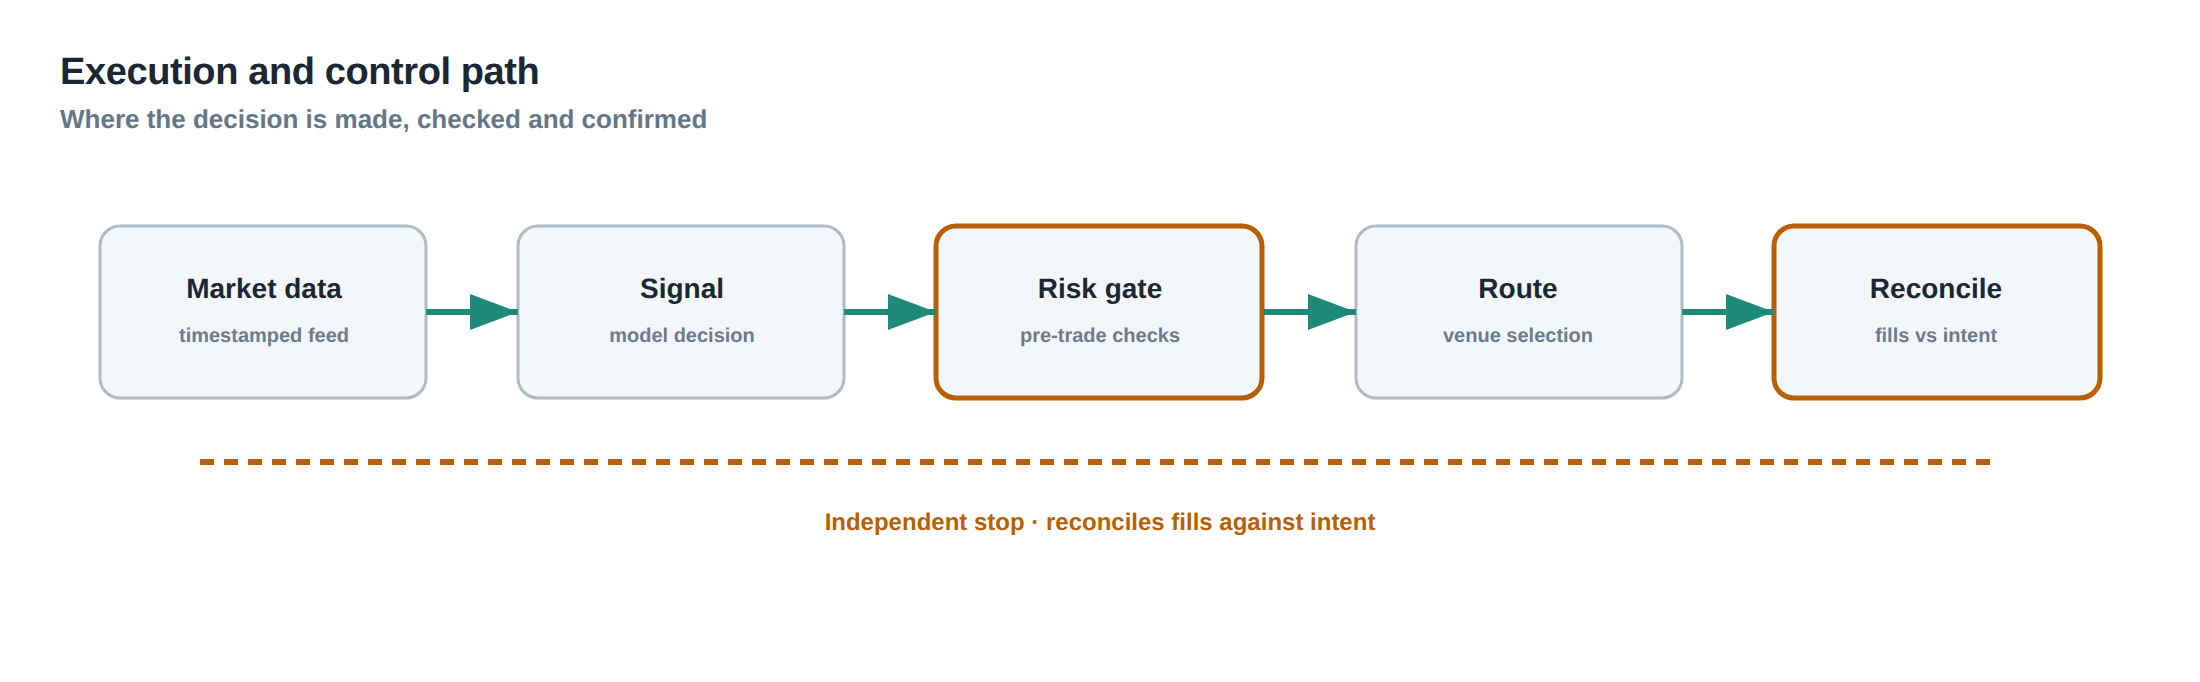
The pre‑trade control chain begins with signal generation, where the strategy tags the intended instrument, quantity, price limit and a timestamp. The order request is then handed to the order‑validation service, which runs the four gates in sequence: quantity/price, frequency, exposure and data‑freshness. If any gate rejects the request, the service returns a structured error object containing a rejection code, the reason, and the current values of the relevant limits. The error is immediately published to a message bus that the operations monitoring system subscribes to. The monitoring system aggregates rejections, highlights patterns – for example a surge in “FREQUENCY_LIMIT” events – and raises alerts to the desk manager. If the order passes all gates, it is forwarded to the execution gateway, which attaches a unique order identifier and places the order into the exchange’s queue. The gateway also records the moment of submission, enabling downstream latency analysis. Throughout the lifecycle, any amendment or cancellation is re‑routed through the same validation service, ensuring that changes cannot bypass the layered checks.
Controls that act before the damage
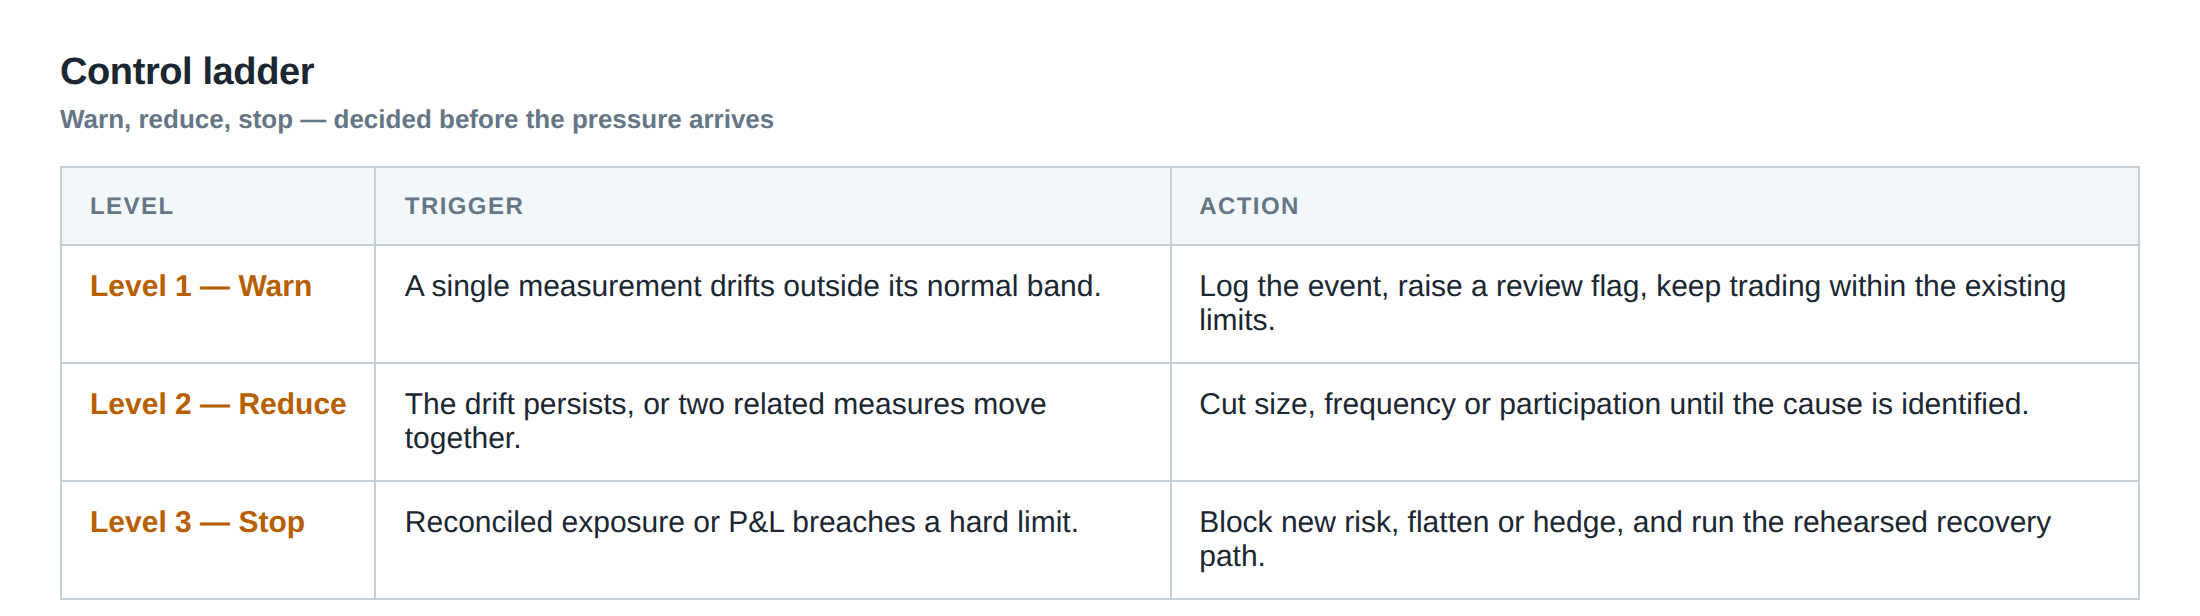
The layered architecture can be visualised as a ladder of safeguards. The bottom rung is the static per‑instrument limit, which provides a hard floor against absurdly large orders. The next rung is the dynamic frequency limiter, which prevents runaway loops and protects the exchange gateway from flooding. Above that sits the exposure aggregation engine, which continuously reconciles positions across strategies, instruments and accounts, applying both soft utilisation bands and hard caps. The penultimate rung is the data‑freshness filter, which discards any order that originates from a market snapshot older than the allowed latency window. The top rung is the observability layer – every rejection is logged with a timestamp, a correlation identifier and the full state of the relevant limits, and the log is streamed to an operations dashboard that can trigger automated remediation scripts. By insisting that an order survive each rung before reaching the exchange, the desk reduces the probability of a catastrophic loss to the product of the individual failure probabilities, which is orders of magnitude smaller than the probability of a single‑threshold breach.
How to measure whether it is working
Effectiveness is assessed by three quantitative signals. First, the rejection‑rate curve: plot the proportion of orders rejected by each gate against the total order flow. A stable curve with a low overall rejection rate but a non‑zero contribution from the exposure gate indicates that the risk aggregation is actively preventing breaches without choking legitimate traffic. Second, the post‑trade loss attribution: for any realised loss, trace whether a pre‑trade gate would have caught the offending order under the current limits. A decreasing share of losses that could have been prevented signals improving control. Third, the latency audit: measure the time between market data receipt and order validation, ensuring that the data‑freshness gate does not introduce excessive delay that could erode expected spread capture. Regular back‑testing of historical order streams against the live gate configuration provides a benchmark for expected versus actual performance.
The portfolio view
From the portfolio manager’s perspective the layered pre‑trade system is a transparent guardrail rather than a black‑box limiter. The manager can query the exposure engine to see the current utilisation of each risk bucket – strategy, instrument, account and firm – and can simulate the impact of a hypothetical order before it is sent. Because every rejection is observable, the manager receives immediate feedback on why a trade was blocked and can adjust the strategy parameters, such as tightening the price‑distance band or reducing the frequency of signal generation. The ladder of controls also enables the desk to allocate risk budgets more efficiently: strategies that consistently operate near their soft bands can be granted higher soft limits, while those that frequently trigger hard caps can be throttled or re‑engineered. The net result is a portfolio that respects its risk appetite while still allowing each algorithm to capture its edge, because the pre‑trade checks are calibrated to the real‑time state of the market and the portfolio rather than to a static, one‑size‑fits‑all threshold.
Do you currently have a layered pre‑trade validation framework that can reject an order based on portfolio‑wide exposure even when the order itself looks innocuous?
About the research behind this lesson
The seminar frames electronic markets as price-time-priority queues. It separates queue value into spread capture versus adverse-selection cost and the option value of retaining a place in line.
Applied to this lesson: An order lifetime therefore cannot be based on elapsed time alone: the system must reassess whether its queue position, expected spread and adverse-selection risk still justify keeping the order alive.
Explore PULSE: System details
PULSE live account: Verify the live account on FX Blue
Live chat and updates: Telegram @xtrskhft
Source: High-Frequency Trading and Modern Market Microstructure
Educational content only. Trading leveraged products involves risk.
Chat with XTRSK
Chat ready
Start a chat and the XTRSK team will be notified immediately.