XCore HFT / Trading Lab
PULSE: Loss limits need a hierarchy
Quantitative execution, market-microstructure, and risk-control research from XTRSK.
What this problem really is
The temptation to rely on a single, trade‑level stop is understandable. A well‑placed stop loss appears to give the trader an immediate safety net: if the market moves against the position, the order is executed and the loss is capped. In practice, however, a stop only controls the realised loss of that specific order. It does not prevent a cascade of small losses across a strategy, nor does it guard against the build‑up of unrealised exposure that can be wiped out in a single market shock. When a desk runs multiple algorithms, each with its own per‑order limits, the aggregate of those limits can easily exceed the daily risk appetite that the firm has set for the whole portfolio. The result is a breach of the higher‑level controls – strategy, account or firm limits – even though every individual trade stayed within its own stop.
The problem deepens when fees, financing charges and currency conversion are ignored. A trade that looks safe on a gross‑price basis may, after transaction costs and overnight funding, be far beyond the loss budget that was originally allocated. Moreover, modern electronic markets operate as price‑time‑priority queues. The value of an order is not simply the time it has been sitting in the book; it is the expected spread capture, the adverse‑selection risk and the option‑like value of retaining a place in line. If a system only checks elapsed time before cancelling an order, it may keep a position alive long after the expected spread has evaporated, exposing the desk to hidden loss potential.
Because the hierarchy of limits – per‑order, per‑strategy, per‑account and per‑firm – is designed to catch exactly these accumulations, a breach at any higher tier must trigger a response that is independent of the lower‑tier stops. The hierarchy must be enforced by a set of warning, reduction and shutdown bands that act before an automatic restart can reset the budget. Only then can the desk preserve capital while still allowing legitimate, low‑risk trading activity.
How the mechanism works, step by step
The first step is to calculate the effective loss for every order as soon as it is placed. Effective loss equals the raw price move that would trigger the stop, plus all ancillary costs: exchange fees, clearing fees, financing (or repo) charges for the expected holding period, and any currency conversion spread if the instrument is denominated in a foreign currency. This figure is stored in a real‑time risk ledger.
Second, the ledger aggregates the effective losses across all active orders belonging to the same strategy. The aggregation is performed separately for realised and unrealised components. Realised loss is the sum of stops that have already been hit; unrealised loss is the mark‑to‑market exposure of open positions, measured after deducting the same cost components. The sum of these two gives the strategy‑level exposure.
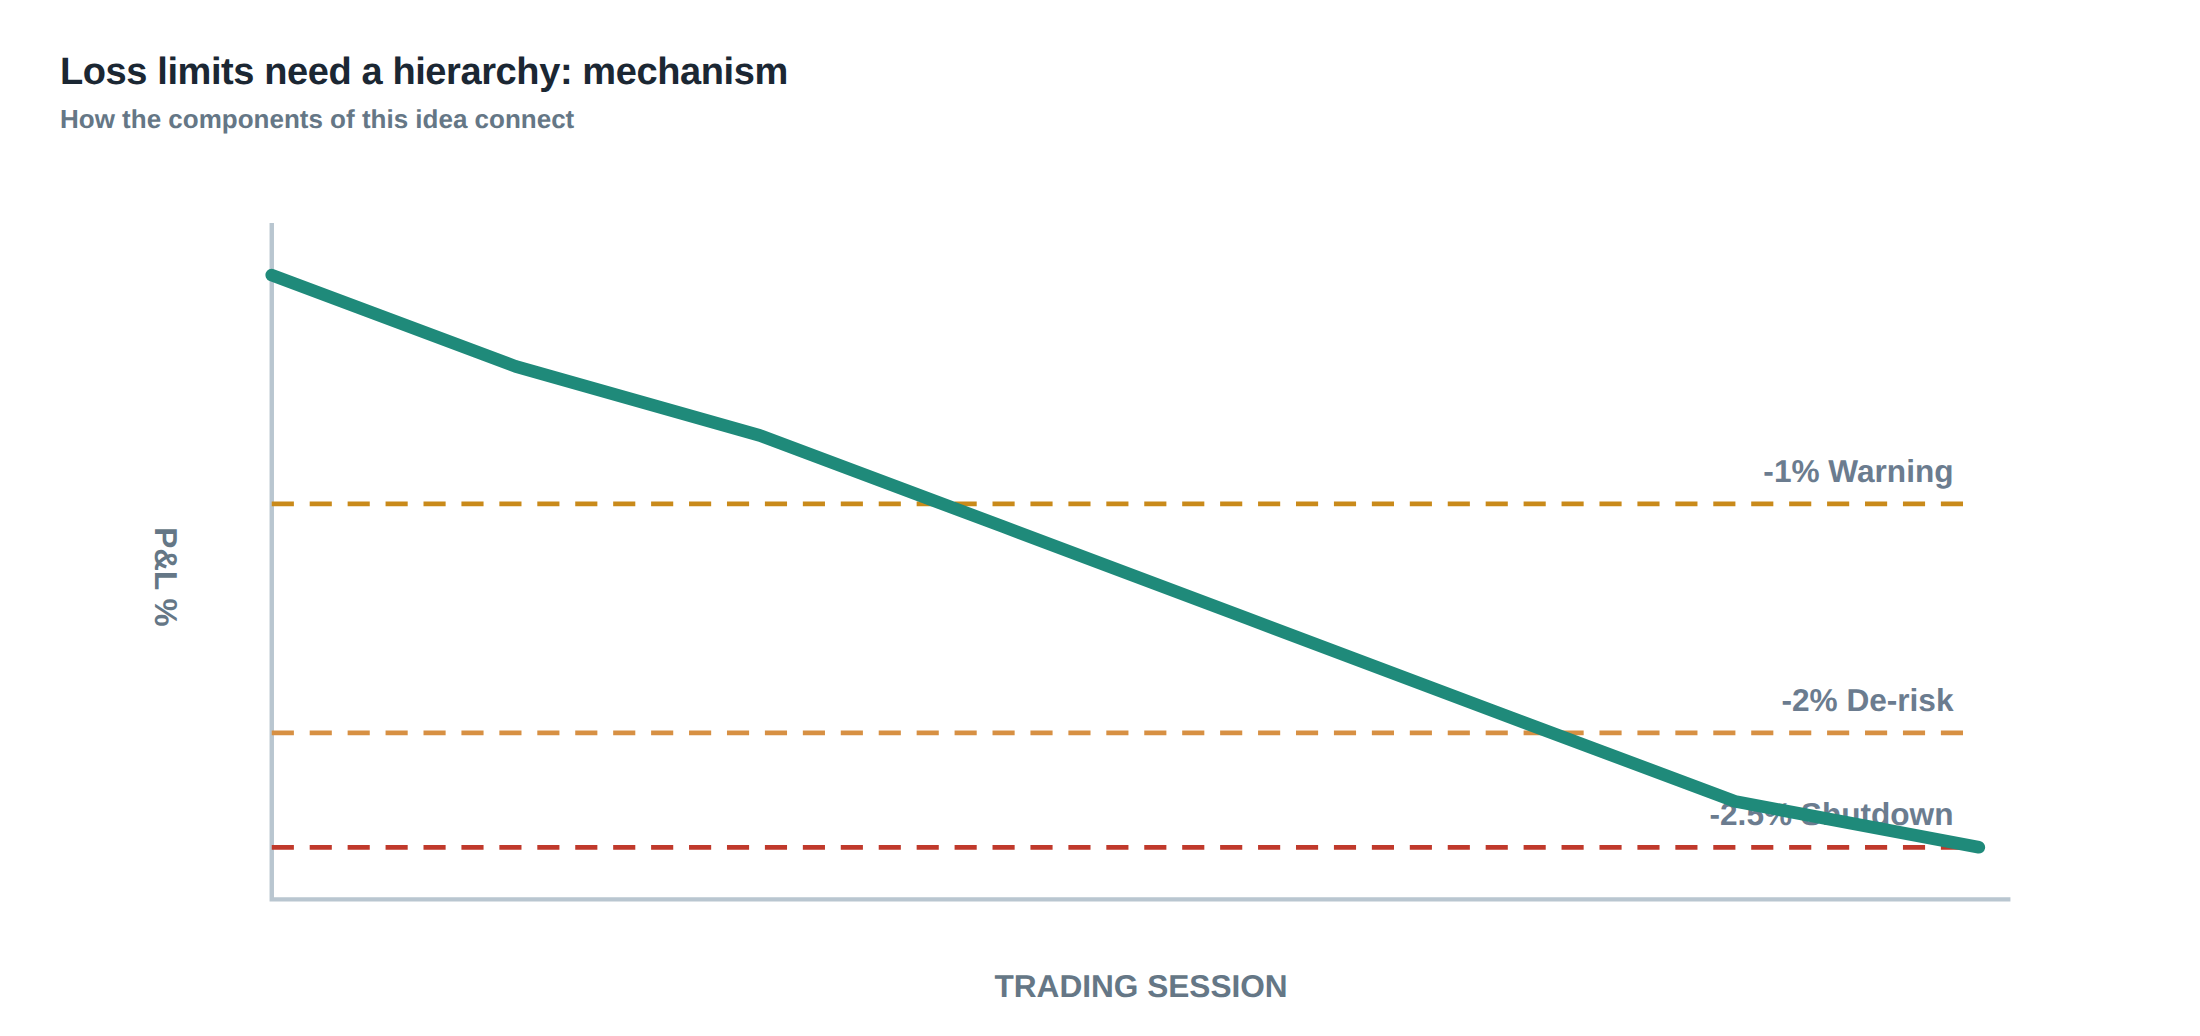
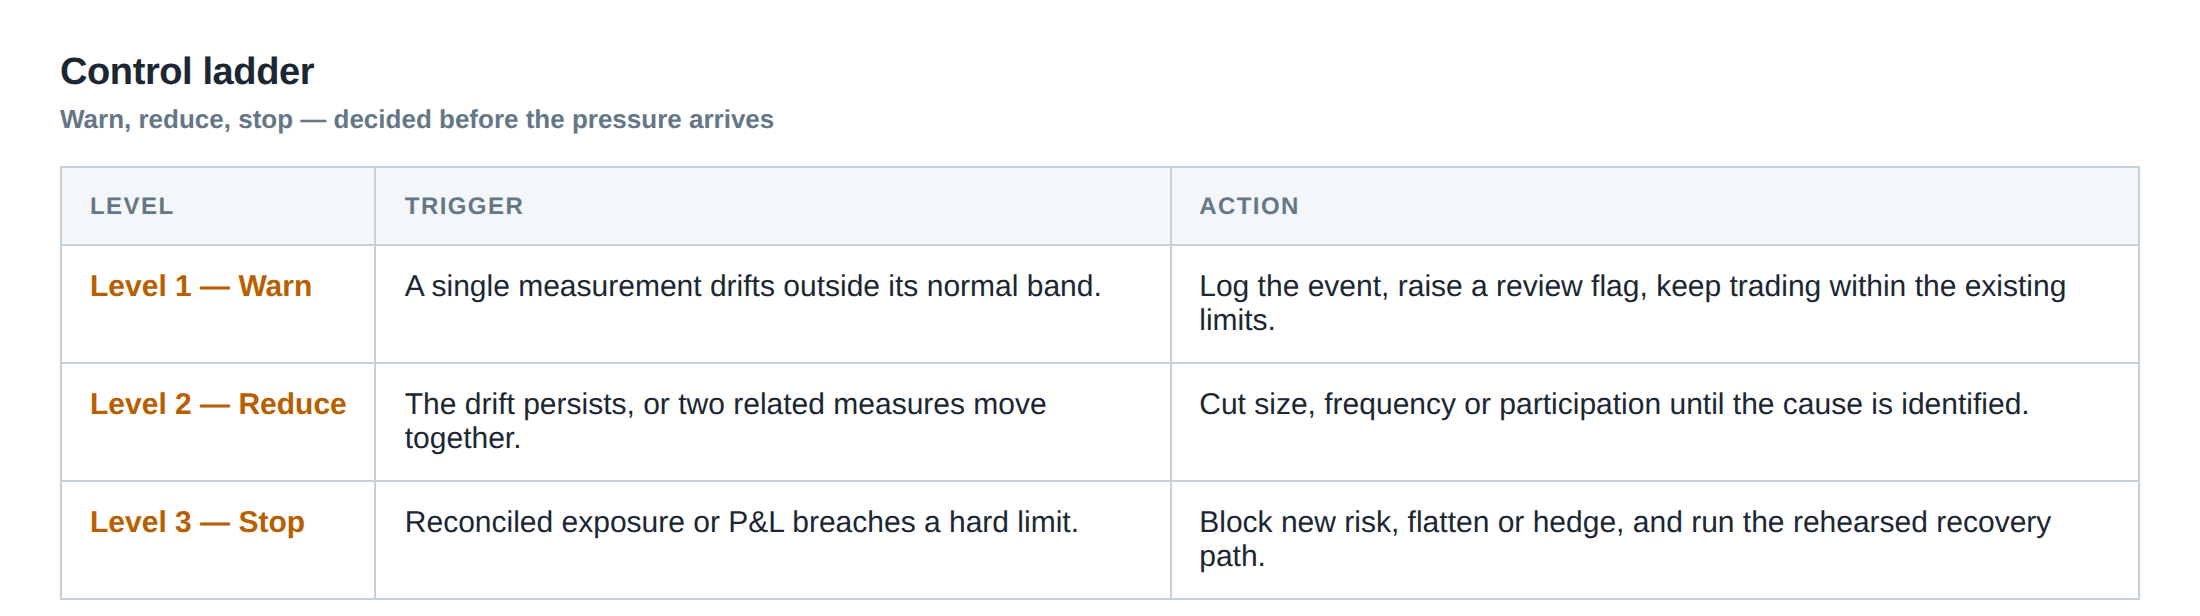
Third, the strategy‑level exposure is compared against three pre‑defined bands. The warning band sits at, for example, 70 % of the daily strategy limit; crossing it raises an alert and forces the execution engine to tighten per‑order stops by a configurable factor (often 20 %). The reduction band at 90 % triggers a mandatory reduction of new order size, and may also invoke a partial liquidate of the most adverse positions. Finally, the shutdown band at 100 % of the daily limit stops all new order flow for that strategy and initiates a forced unwind of the most exposed positions, respecting market impact constraints.
Fourth, the strategy‑level exposure rolls up into the account‑level exposure, which adds together the exposures of all strategies run under the same capital allocation. The same three‑band logic applies, but with higher thresholds reflecting the larger capital base.
Fifth, the account‑level exposure feeds the firm‑level exposure, which aggregates across all desks, accounts and asset classes. At this top tier the shutdown band is absolute: any breach triggers a hard stop on all trading activity until senior risk managers approve a reset. Crucially, the system records the breach event and disables any automatic restart that would otherwise reset the exposure counters at the start of a new trading day. The budget can only be reset manually after a post‑mortem review.
A worked example with real numbers
Consider a desk that trades a EUR‑USD futures contract (tick size 0.00005, tick value $12.50) and a S&P 500 index future (tick size 0.25, tick value $12.50). The per‑order stop is set at 20 ticks for each instrument, which translates to a gross loss limit of $250 per trade. Exchange fees are $2 per contract, clearing fees $0.50, and financing charges for a typical overnight hold are $0.10 per contract. For the EUR‑USD future the currency conversion spread is an additional $0.20 per contract.
The desk runs ten independent algorithms that each open a single position per day, all with the same 20‑tick stop. On a particular day the market moves against each algorithm by exactly 18 ticks, so none of the per‑order stops are hit. The raw price loss per contract is therefore 18 × $12.50 = $225. Adding fees, financing and conversion gives an effective loss of $225 + $2 + $0.50 + $0.10 + $0.20 = $228 per contract.
Because each algorithm trades one contract, the realised loss for the day is still zero – no stops have been triggered. However, the unrealised loss across the ten contracts is 10 × $228 = $2 280. The desk’s daily strategy limit for this set of algorithms is $2 000. The warning band at 70 % is $1 400, the reduction band at 90 % is $1 800, and the shutdown band at 100 % is $2 000. At $2 280 the exposure has already breached the shutdown band by 14 %.
According to the hierarchy, the system must now halt any new order submissions for the affected strategies, raise a high‑severity alert, and begin a controlled unwind. The unwind proceeds by first reducing the size of the most adverse positions – those with the highest unrealised loss – by half, which brings the exposure down to $1 140 (still above the warning band but below the reduction band). A second pass, respecting market depth, reduces the remaining positions by another 30 %, finally pulling the exposure under the daily limit at $1 620.
Because the breach occurred after the market close, the automatic daily reset that would normally clear the exposure ledger is suppressed. The risk ledger retains the $1 620 figure into the next session, and the desk’s capital allocation for the following day is reduced by the same amount until senior approval is obtained. This prevents the false impression that the budget has been “reset” and allows the desk to learn from the concentration risk that ten seemingly independent trades posed.
Where it breaks in live markets
In a live environment the hierarchy is most vulnerable when market conditions cause many strategies to react to the same underlying factor – for example, a sudden shift in the US dollar index that simultaneously affects EUR‑USD futures, emerging‑market currency contracts and commodity‑linked equities. The per‑order stops may never be reached because the price move is gradual, but the aggregate unrealised loss can climb quickly, breaching the daily strategy limit before any individual alarm is raised.
Another failure point is the treatment of fees and financing. Many execution platforms report only the gross price movement, leaving the risk engine to add cost components after the fact. If the cost model is out of sync with the actual charges (e.g., a change in clearing fees that is not reflected in the ledger), the effective loss will be understated, and the hierarchy will give a false sense of security.
A third source of breakdown is the automatic restart logic that many desks embed in their end‑of‑day scripts. When the script simply zeros the exposure counters at midnight, the memory of a breach is erased. Traders may then resume normal order flow, unaware that the previous day’s concentration risk has not been fully resolved. This can lead to a repeat of the same pattern, magnifying the eventual loss.
Finally, the queue‑value perspective shows that an order’s lifetime cannot be governed solely by elapsed time. If an algorithm keeps an order alive for a fixed 30‑minute window without reassessing the expected spread capture, the order may sit in the queue while the market’s liquidity dries up, turning a neutral position into a costly adverse‑selection exposure. The hierarchy must therefore incorporate a dynamic reassessment of queue position, not just a static time‑out.
The operating path, stage by stage
Stage 1 begins when an order is generated by a strategy. The order packet contains the intended stop distance, the instrument’s fee schedule, financing rate and any required currency conversion factor. The risk engine immediately computes the gross stop loss and adds the ancillary costs to obtain the effective loss.
Stage 2 records this effective loss in the per‑order ledger and updates the aggregate exposure for the relevant strategy. The ledger distinguishes between realised loss (stops already hit) and unrealised loss (current mark‑to‑market).
Stage 3 compares the strategy‑level exposure against the three bands. If the exposure is below the warning band, the order proceeds unchanged. If it crosses the warning band, the system automatically tightens the stop distance for subsequent orders from that strategy by a preset multiplier, and an alert is sent to the desk’s risk monitor.
Stage 4 is entered when the reduction band is breached. The engine reduces the maximum order size for the strategy, and may also flag the most adverse positions for partial liquidation. The exposure is continuously re‑evaluated as market prices evolve.
Stage 5 is triggered at the shutdown band. All new order flow for the strategy is blocked, and a forced unwind of the largest unrealised losses is launched. The unwind respects a market‑impact model that spreads the execution over a configurable time horizon to avoid further price disruption.
Stage 6 rolls the strategy exposure up to the account level. The same three‑band logic applies, but with higher thresholds reflecting the total capital allocated to the account. If the account shutdown band is hit, the desk’s entire order flow is halted, and senior risk managers must approve any restart.
Stage 7 aggregates across all accounts to the firm level. The firm‑wide shutdown band is absolute; breaching it forces a firm‑wide trading freeze and initiates a post‑mortem review before any exposure counters may be cleared. The hierarchy thus ensures that a breach at any level is contained before it can propagate upward.
Controls that act before the damage
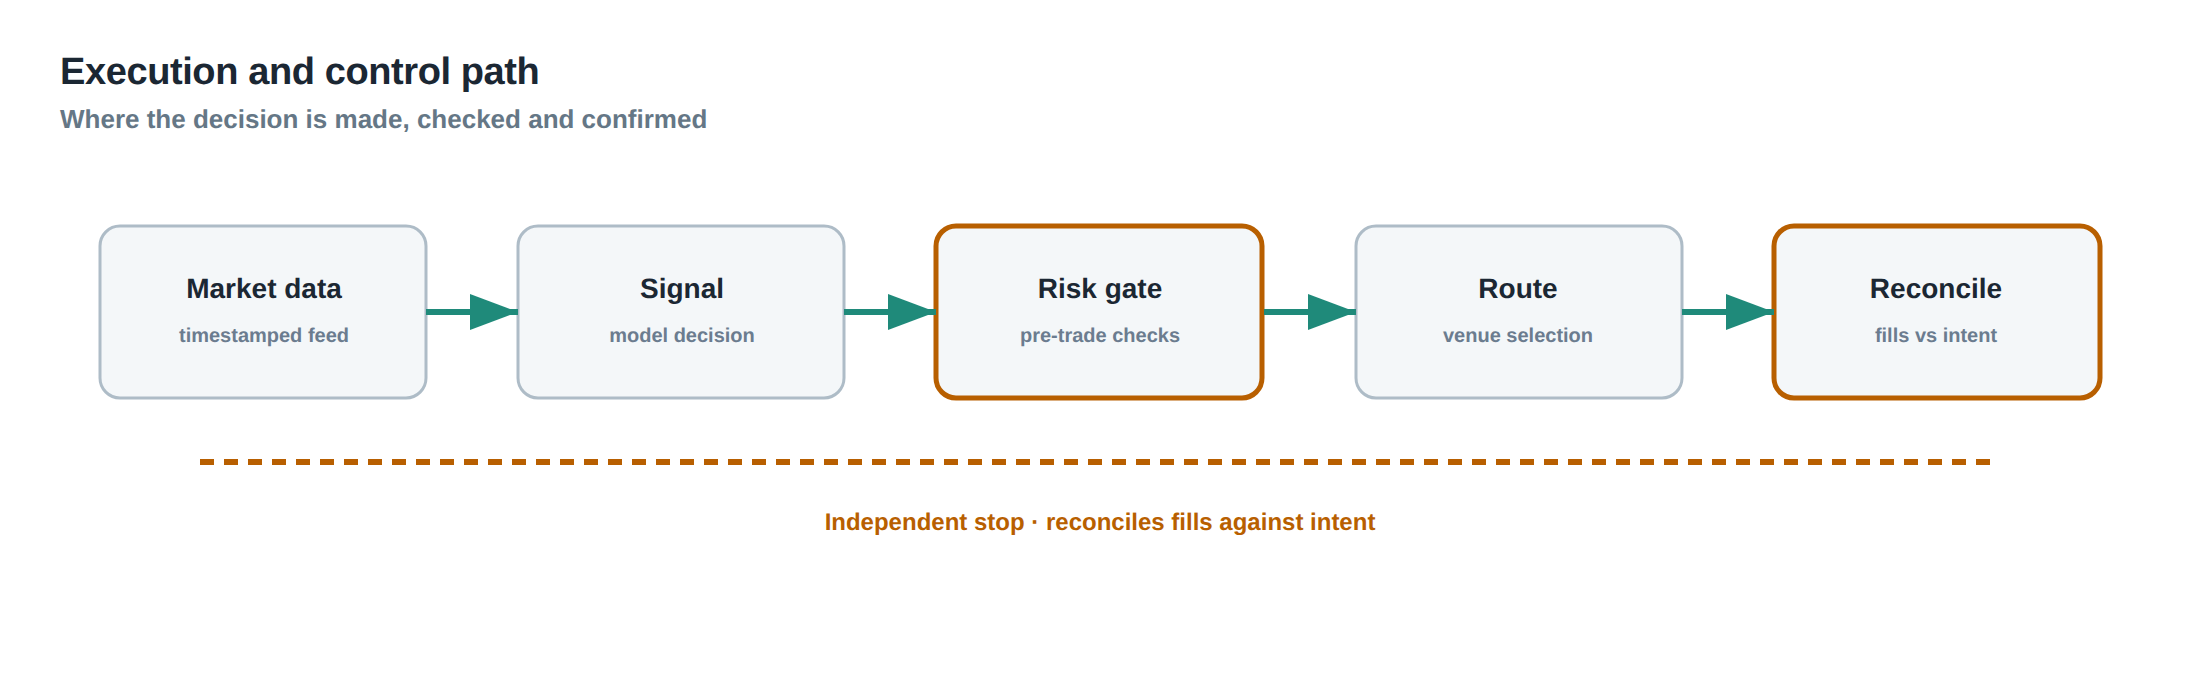
The first line of defence is the pre‑trade validation. Before an order leaves the strategy engine, the risk module checks that the projected effective loss, including fees, financing and conversion, does not exceed the per‑order stop limit. If it does, the order is rejected and the strategy is asked to re‑size.
The second defence is the dynamic queue reassessment. At regular intervals – for example, every five seconds – the system evaluates the expected spread capture for each live order based on current order‑book depth and recent execution statistics. If the expected spread falls below a predefined threshold, the order’s stop distance is tightened or the order is cancelled, preventing the build‑up of adverse‑selection risk.
The third defence is the band‑based throttling described earlier. By tightening stops, capping order size and eventually halting new flow, the hierarchy curtails the rate at which unrealised loss can accumulate.
A fourth control is the budget‑freeze on restart. When a breach occurs, the exposure ledger is flagged as “locked”. The daily reset script checks this flag; if it is set, the script leaves the exposure values intact and writes a log entry indicating that manual intervention is required. This prevents the automatic restart from wiping the memory of the breach.
Finally, a post‑trade audit runs at the end of each session. It reconciles the recorded effective losses with the actual fees and financing charges posted by the clearing house, adjusting the ledger for any discrepancies. The audit also aggregates the realised and unrealised components to verify that the hierarchy’s thresholds were respected throughout the day.
How to measure whether it is working
The primary metric is the band‑breach frequency. Over a rolling 30‑day window, the desk records how often the warning, reduction and shutdown bands are touched at each hierarchy level. A well‑tuned system should see warning‑band breaches occur regularly – they are an early‑warning sign – while reduction‑band breaches should be rare, and shutdown‑band breaches virtually nonexistent.
A second metric is the cost‑adjusted loss ratio. This is the ratio of total realised loss (including fees, financing and conversion) to the total notional traded, measured after the hierarchy’s controls have been applied. A declining ratio indicates that the inclusion of ancillary costs in the effective loss calculation is preventing hidden leakage.
A third indicator is the queue‑value decay. By tracking the expected spread capture of live orders over time, the desk can quantify how often the dynamic reassessment leads to order cancellation before the stop is hit. A high decay rate suggests that the system is correctly pruning orders that have lost their economic rationale.
The final measurement is the reset‑lock compliance rate. After any breach, the system should log a manual reset request. The proportion of breaches that are followed by a manual reset within the prescribed review window (typically 24 hours) reflects adherence to the “prevent automatic restart” rule.
The portfolio view
From the portfolio perspective, the hierarchy of loss limits is not a series of isolated checks but a coherent, multi‑layered safety net that aligns individual trade behaviour with the desk’s overall risk appetite. Each trade contributes a cost‑adjusted loss figure to the portfolio’s P&L, and the aggregation of these figures respects the same warning, reduction and shutdown bands that govern the constituent strategies.
When the portfolio is examined in aggregate, the realised loss component tells the story of how many stops have been triggered, while the unrealised component reveals the latent exposure that could become realised under stress. The portfolio manager can therefore monitor the distance to each band in real time, adjusting capital allocations between strategies to keep the overall exposure comfortably within the firm‑level limits.
Because the hierarchy incorporates fees, financing and currency conversion at the earliest stage, the portfolio’s risk metrics are already net of the most common hidden costs. This prevents the illusion of “free” capacity that often arises when gross notional figures are used in isolation.
The final safeguard – the lock on automatic restarts – ensures that a breach leaves a permanent imprint on the portfolio’s risk state until senior oversight validates a reset. In this way, the portfolio view remains honest about the true cost of risk taking, and the desk can make disciplined decisions about scaling, hedging or withdrawing capital from strategies that repeatedly push the hierarchy toward its upper bands.
Will your current loss‑limit framework survive a day when ten seemingly independent trades conspire to breach the daily risk appetite?
About the research behind this lesson
The seminar frames electronic markets as price-time-priority queues. It separates queue value into spread capture versus adverse-selection cost and the option value of retaining a place in line.
Applied to this lesson: An order lifetime therefore cannot be based on elapsed time alone: the system must reassess whether its queue position, expected spread and adverse-selection risk still justify keeping the order alive.
Explore PULSE: System details
PULSE live account: Verify the live account on FX Blue
Live chat and updates: Telegram @xtrskhft
Source: High-Frequency Trading and Modern Market Microstructure
Educational content only. Trading leveraged products involves risk.
Chat with XTRSK
Chat ready
Start a chat and the XTRSK team will be notified immediately.