PULSE EA / Research
PULSE EA Backtesting
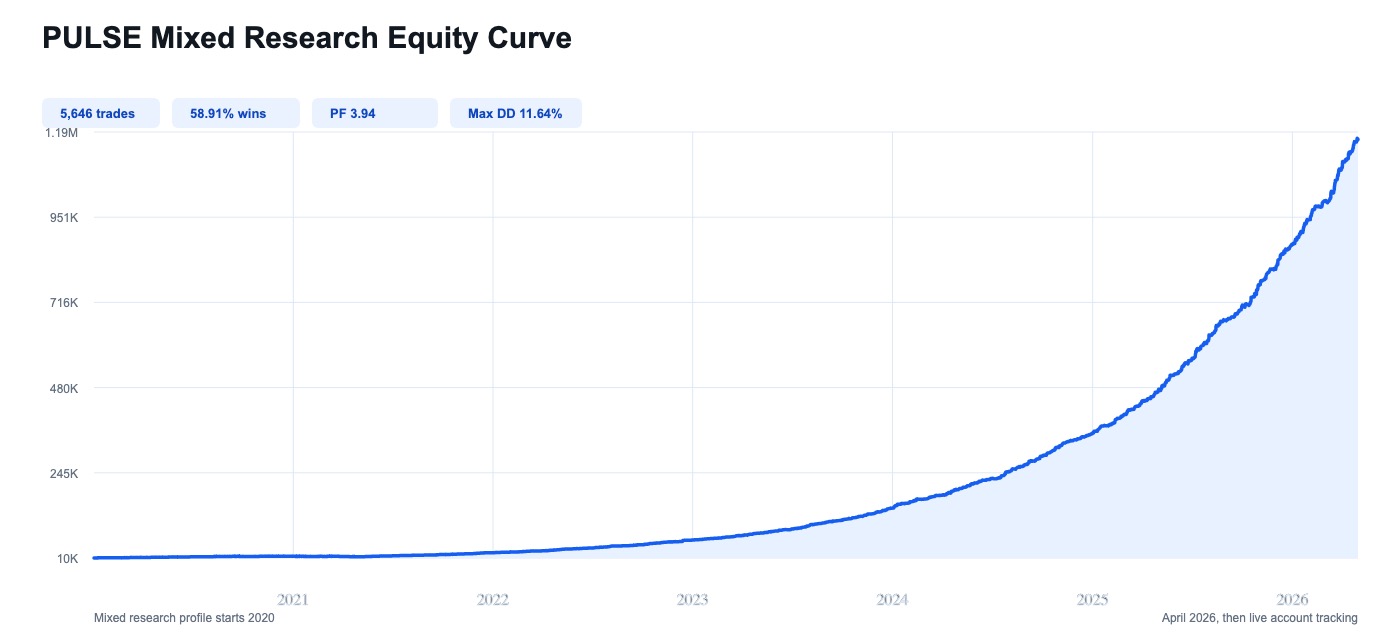
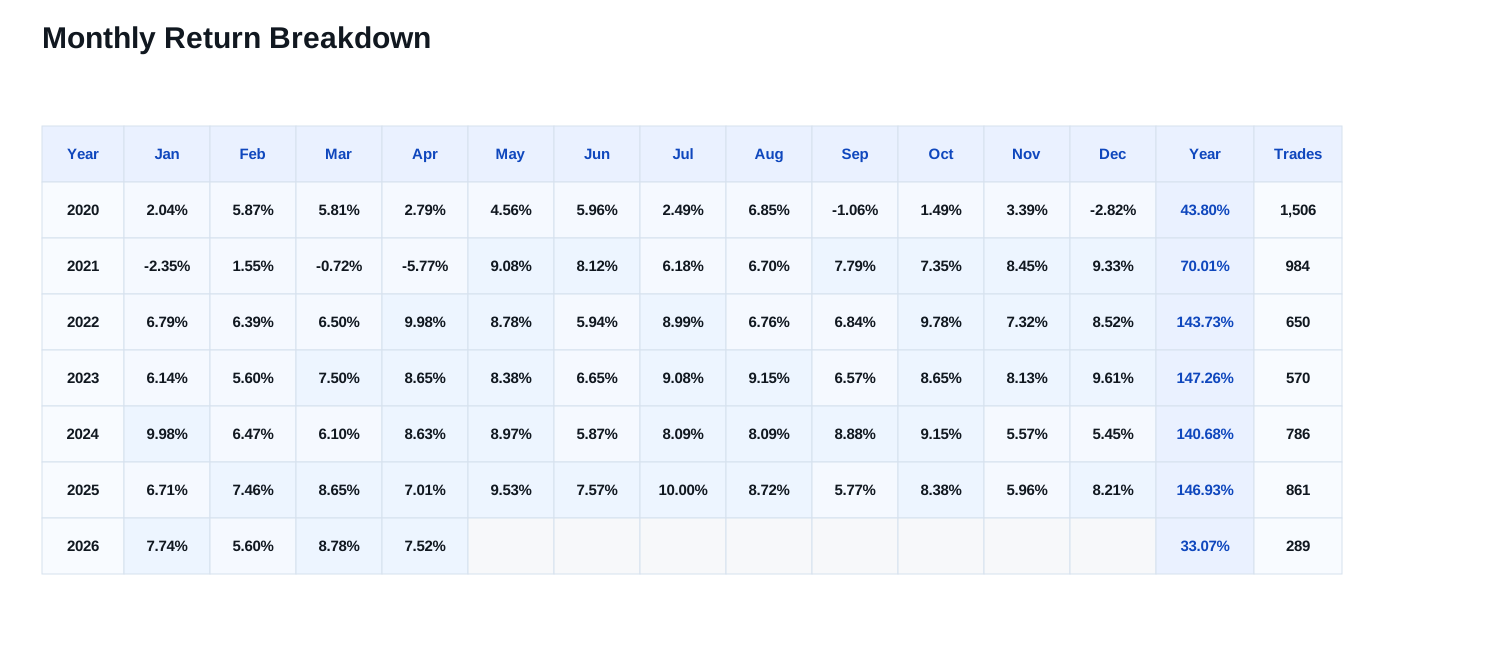
A dedicated review of the historical PULSE EA research profile, including the equity curve, monthly research breakdown, trade count, win rate, profit factor, and drawdown context.
Research timeline
Backtesting research result
The PULSE research profile shown here covers January 2020 through April 2026 and is used to study fast-trigger entries, sharp exits, drawdown sensitivity, and 100 ms-200 ms execution behavior.
What the research shows
The historical research window is designed around the same investor point as PULSE: fast-trigger gold exposure, controlled exits, trailing behavior, 100 ms-200 ms execution conditions, and no grid or martingale recovery. From May 2026 onward, the relevant review is the live account, because the system is no longer being discussed only as a historical research profile.
Backtesting note
How to read this research
The backtest is useful for studying the historical behavior of the PULSE EA logic under defined assumptions. It is not a live-audited return statement and should be read alongside the live-account page, where post-research performance belongs.
The JPG graph is provided for sharing and review where SVG previews are not accepted.
Chat with XTRSK
Chat ready
Start a chat and the XTRSK team will be notified immediately.