
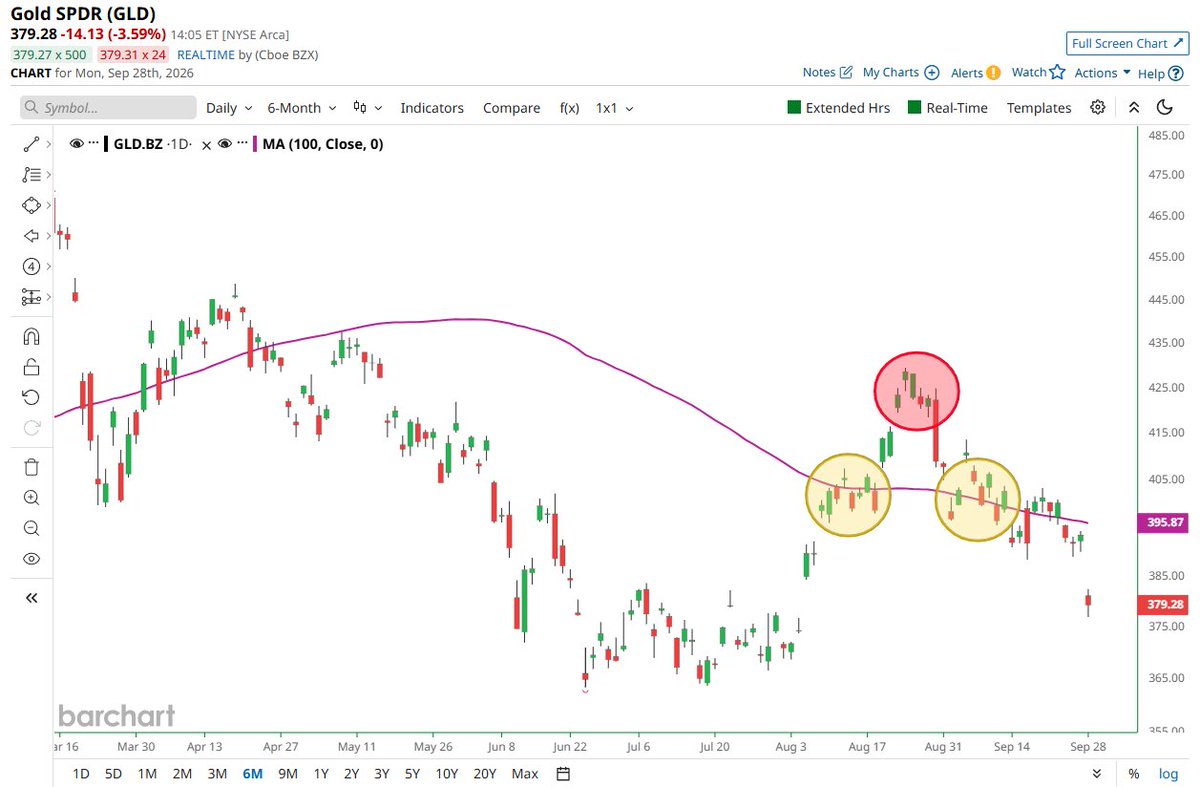
Decoding the GLD Head‑and‑Shoulders Breakdown and Its Quantitative Implications
Research preview
The gold‑linked exchange‑traded fund recently displayed a textbook head‑and‑shoulders formation that culminated in a sharp decline. This article explains the geometry of the pattern, the mathematics behind the move, and how a quantitative trading team can embed the signal into systematic models. Recognising the Pattern in Real‑Time Data A head‑and‑shoulders chart consists of three peaks: a left shoulder, a higher head, and a right shoulder that roughly matches the first peak. The neckline is drawn by connecting the troughs that separate the shoulders from the head. When price breaks below this neckline, the pattern is considered complete and a downside move is expected....
Client research
Register free or login to read the full report
Registration is free. The full report includes chart snapshots, level work, technical tables, catalyst context, and the complete desk read.
Chat with XTRSK
Chat ready
Start a chat and the XTRSK team will be notified immediately.