XCore HFT / Trading Lab
PULSE: Bad timestamps can invent HFT alpha
Quantitative execution, market-microstructure, and risk-control research from XTRSK.
What this problem really is
There is a version of this problem that looks tidy in a slide and behaves very differently once orders reach a live venue. Microsecond analysis is unreliable when feeds, orders and fills are not aligned to a trustworthy clock.
Bad timestamps can invent HFT alpha. is easy to describe and harder to operate, and the gap between the description and the operation is where trading risk accumulates. The mechanism is a sequence, not a single decision. Each stage consumes the output of the previous one, and a small error early in the chain is amplified by everything that follows.
The mechanism is a sequence, not a single decision. Each stage consumes the output of the previous one, and a small error early in the chain is amplified by everything that follows.
Read the idea as a pipeline: observation, interpretation, permission, execution and reconciliation. The desk is only as strong as the weakest of those links on the day it matters.
The system becomes understandable when every transition is timestamped and every assertion is checkable against an independent record.
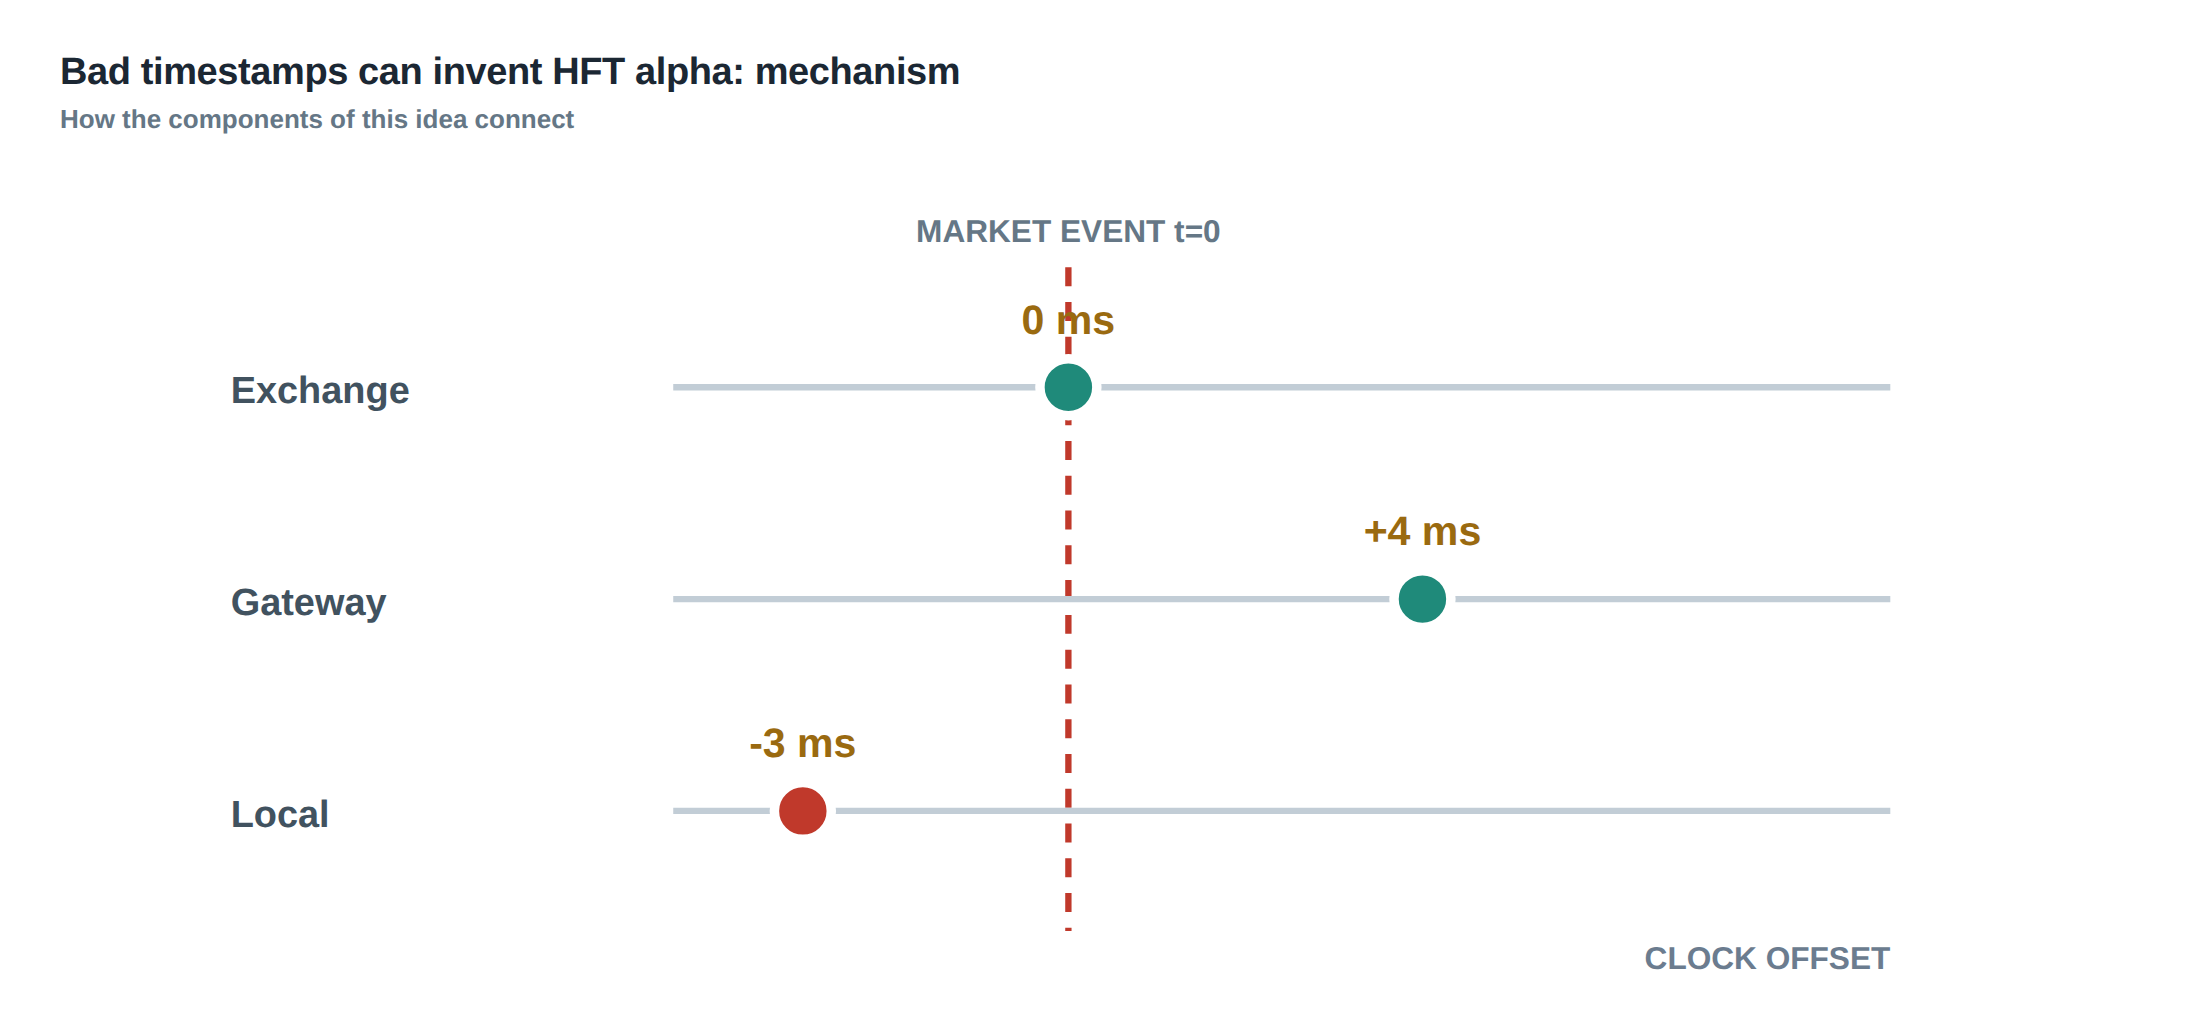
How the mechanism works, step by step
1) Store exchange, gateway and local receive timestamps separately. 2) Monitor clock offset and drift. 3) Preserve sequence numbers and correction messages. 4) Test out-of-order and duplicate events. 5) Measure when information was knowable rather than when it was later recorded.
When the desk cannot explain the mechanism in one page of plain language, the model is usually hiding an assumption rather than simplifying one.
The mechanism is only as reliable as its least observable stage, so measurement effort should follow the weakest link rather than the most interesting one.
A useful test is to ask which single record, if it were lost, would make the result impossible to explain; that record is the one to protect first.
The first failure mode is silent drift: the measurement that justified the strategy stops matching the conditions that produce it, and nobody is watching the difference between the two.
A worked example with real numbers
A backtest can appear to predict a price change when the trade feed is timestamped earlier than the quote update that actually arrived first.
The point of the example is to locate the break-even assumption. The strategy is a bet that this assumption holds more often than the cost of being wrong.
Write the result as a range rather than a point estimate, so the reader can see which variable dominates the outcome.
If a small change in one input flips the sign of the result, that input deserves a limit and a monitor of its own.
State the holding period explicitly. An edge measured over milliseconds and one measured over days need entirely different controls.
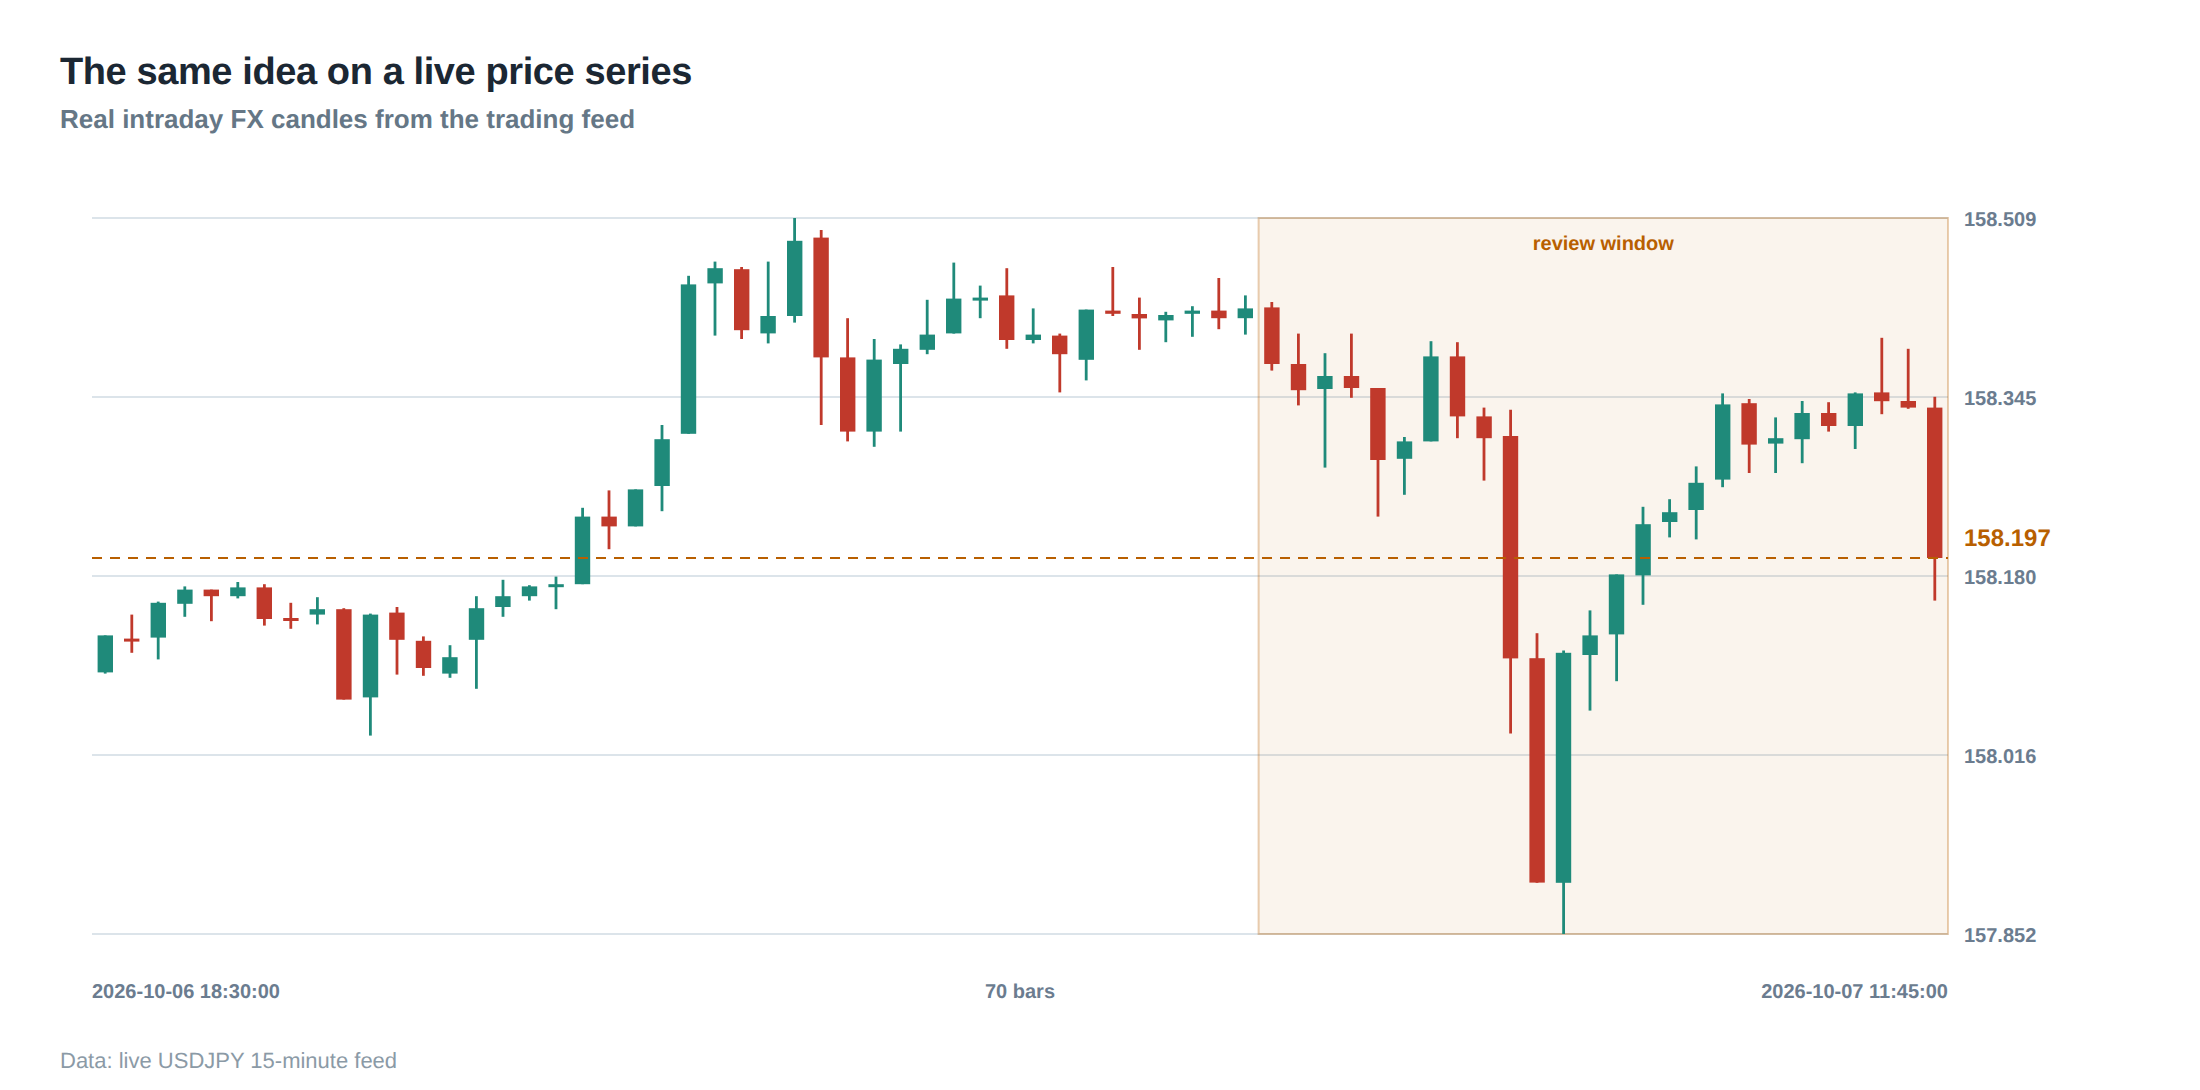
Where it breaks in live markets
The fifth is the recovery path. A desk that can stop but cannot restart safely has only solved half of the problem it set out to solve.
The first failure mode is silent drift: the measurement that justified the strategy stops matching the conditions that produce it, and nobody is watching the difference between the two.
The second is a control that exists in configuration but not in behaviour. A limit that reads stale or unreconciled state is documentation, not protection.
The third is concentration. Several positions that look independent share a factor, a venue or a liquidity source, and the book quietly becomes one larger bet than the dashboard suggests.
The fourth is capacity. The same signal that earns a thin edge at small size consumes that edge through market impact as the order grows.
The operating path, stage by stage
A compact checklist is: 1) preserve sequence numbers and correction messages; 2) test out-of-order and duplicate events; 3) measure when information was knowable rather than when it was later recorded.
A rehearsed recovery is part of the operating path, not an afterthought once the incident has already started.
Give each stage an owner and a reason code so that a post-mortem can reconstruct the path without relying on memory.
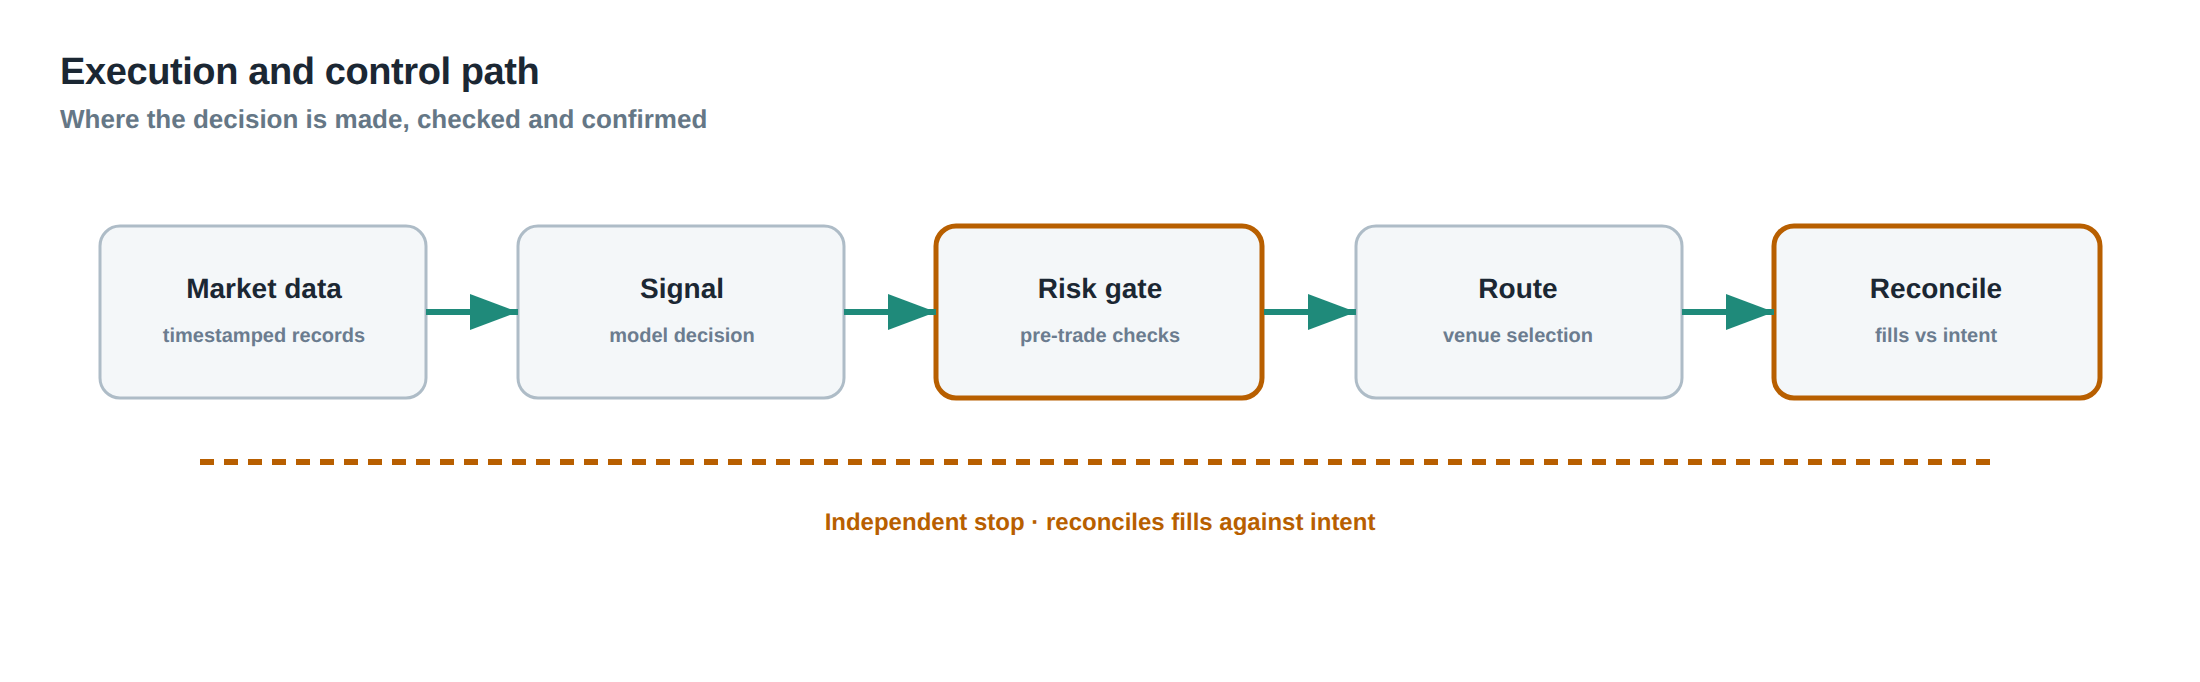
The path should be short enough to reason about and instrumented enough to prove. Every extra hop is another place for state to diverge.
Reconciliation closes the loop: the system compares intended exposure with confirmed exposure and refuses to continue on an unexplained gap.
Controls that act before the damage
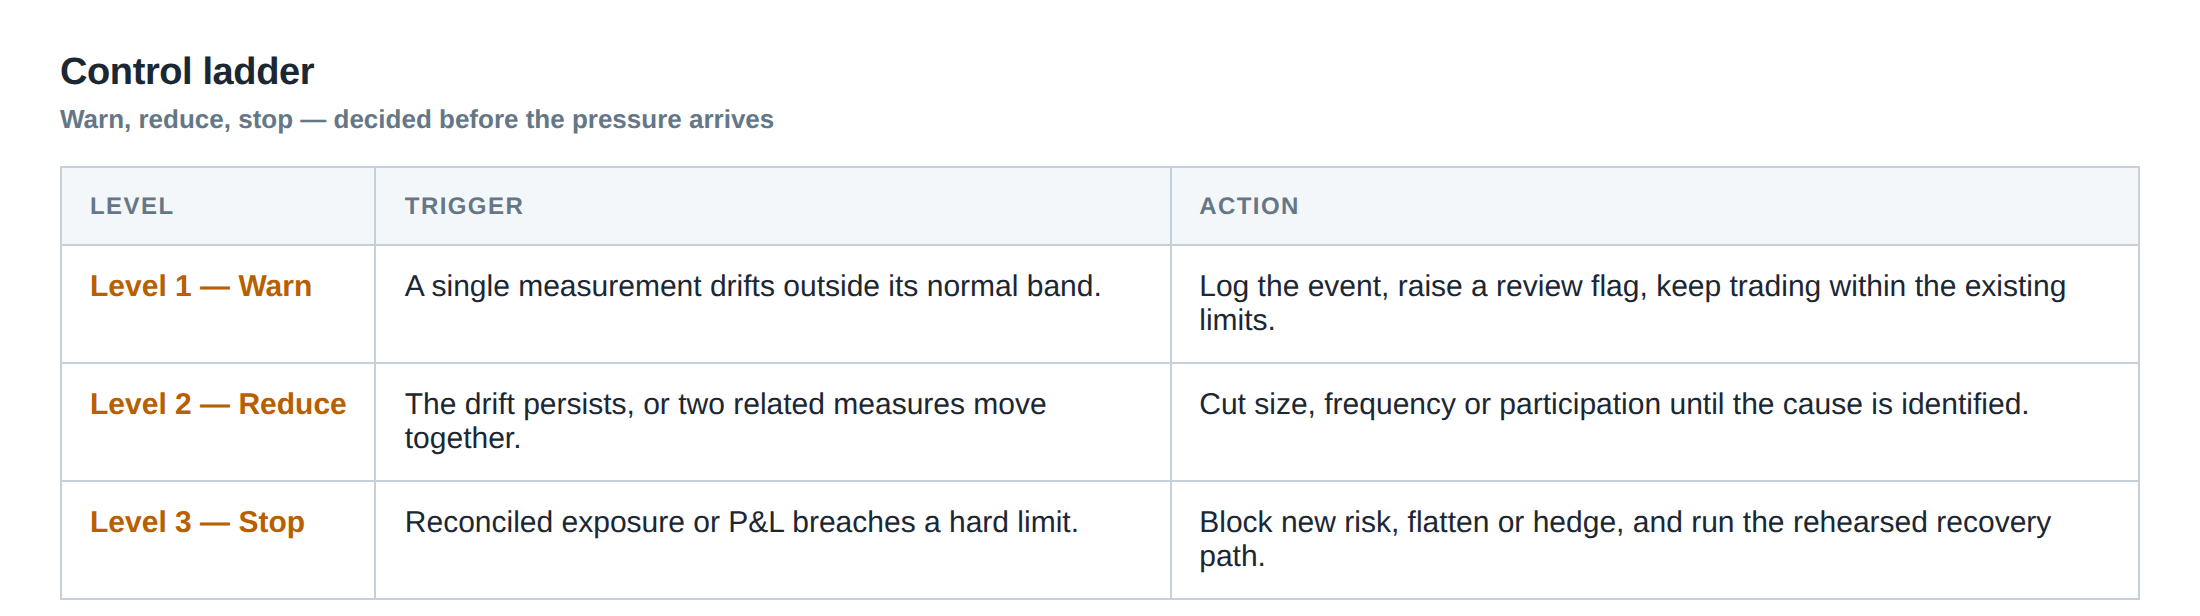
Use a three-level ladder. Level one warns and records; level two reduces size, frequency or participation; level three blocks new risk and invokes the rehearsed recovery path.
Every limit needs a named owner, an observable trigger and a tested response that does not depend on the component that failed.
Prefer several narrow, well-understood limits over one clever aggregate that nobody can explain under pressure.
A control that fires constantly is a design fault, while a control that never fires has not really been tested.
The sequence matters: warn, then reduce, then stop, with each step leaving a record that the next one can trust.
How to measure whether it is working
Track the frequency and duration of abnormal states, not just their existence. A control that fires constantly is a design problem, not a safeguard.
Choose a denominator and keep it fixed. Changing the base between reports makes progress impossible to judge.
Separate leading indicators that move first from lagging outcomes that confirm later; the leading ones buy time to act.
Compare live behaviour with the backtest under the same regime, not against the best historical period.
Set the review cadence before the pressure arrives, so the response becomes a decision rather than a reaction.
Turning the idea into a daily routine
A deep idea earns its keep only when it becomes a routine check that somebody actually runs. Write the check as a question with a numeric answer, not as a principle.
Start each session by confirming that the data, the clock and the venue state agree. Most model failures are really synchronisation failures discovered late.
Review the previous session against the same three questions: what was expected, what happened, and what was the largest unexplained gap.
Keep a short list of conditions that would make the desk stand down. A pre-committed exit is worth more than a clever entry.
The portfolio view
The account experiences combined profit, loss and liquidity demand even when the models are monitored in separate dashboards.
Risk should aggregate across instruments and strategies before another order is allowed to consume scarce liquidity or margin.
Aggregate by risk factor rather than by strategy label, because two desks can easily be one position.
Ask what happens to the whole book if the shared dependency fails at the worst moment, then size for that day rather than for the average one.
Which single measurement would tell you first that this control has stopped working in your own order path?
About the research behind this lesson
Andrew Lo's lectures build risk analysis from return distributions and statistical measures, rather than treating one realised result as a complete description of risk.
Applied to this lesson: For a fast strategy, median latency or average fill quality is not enough. The review has to include tail delays, stale-order frequency and the loss distribution when cancellation or routing behaves abnormally.
Explore PULSE: System details
PULSE live account: Verify the live account on FX Blue
Live chat and updates: Telegram @xtrskhft
Source: Risk and Return
Educational content only. Trading leveraged products involves risk.
Chat with XTRSK
Chat ready
Start a chat and the XTRSK team will be notified immediately.