
XCore HFT / Trading Lab
DMA gives control and responsibility
Quantitative execution, market-microstructure, and risk-control research from XTRSK.
What this problem really is
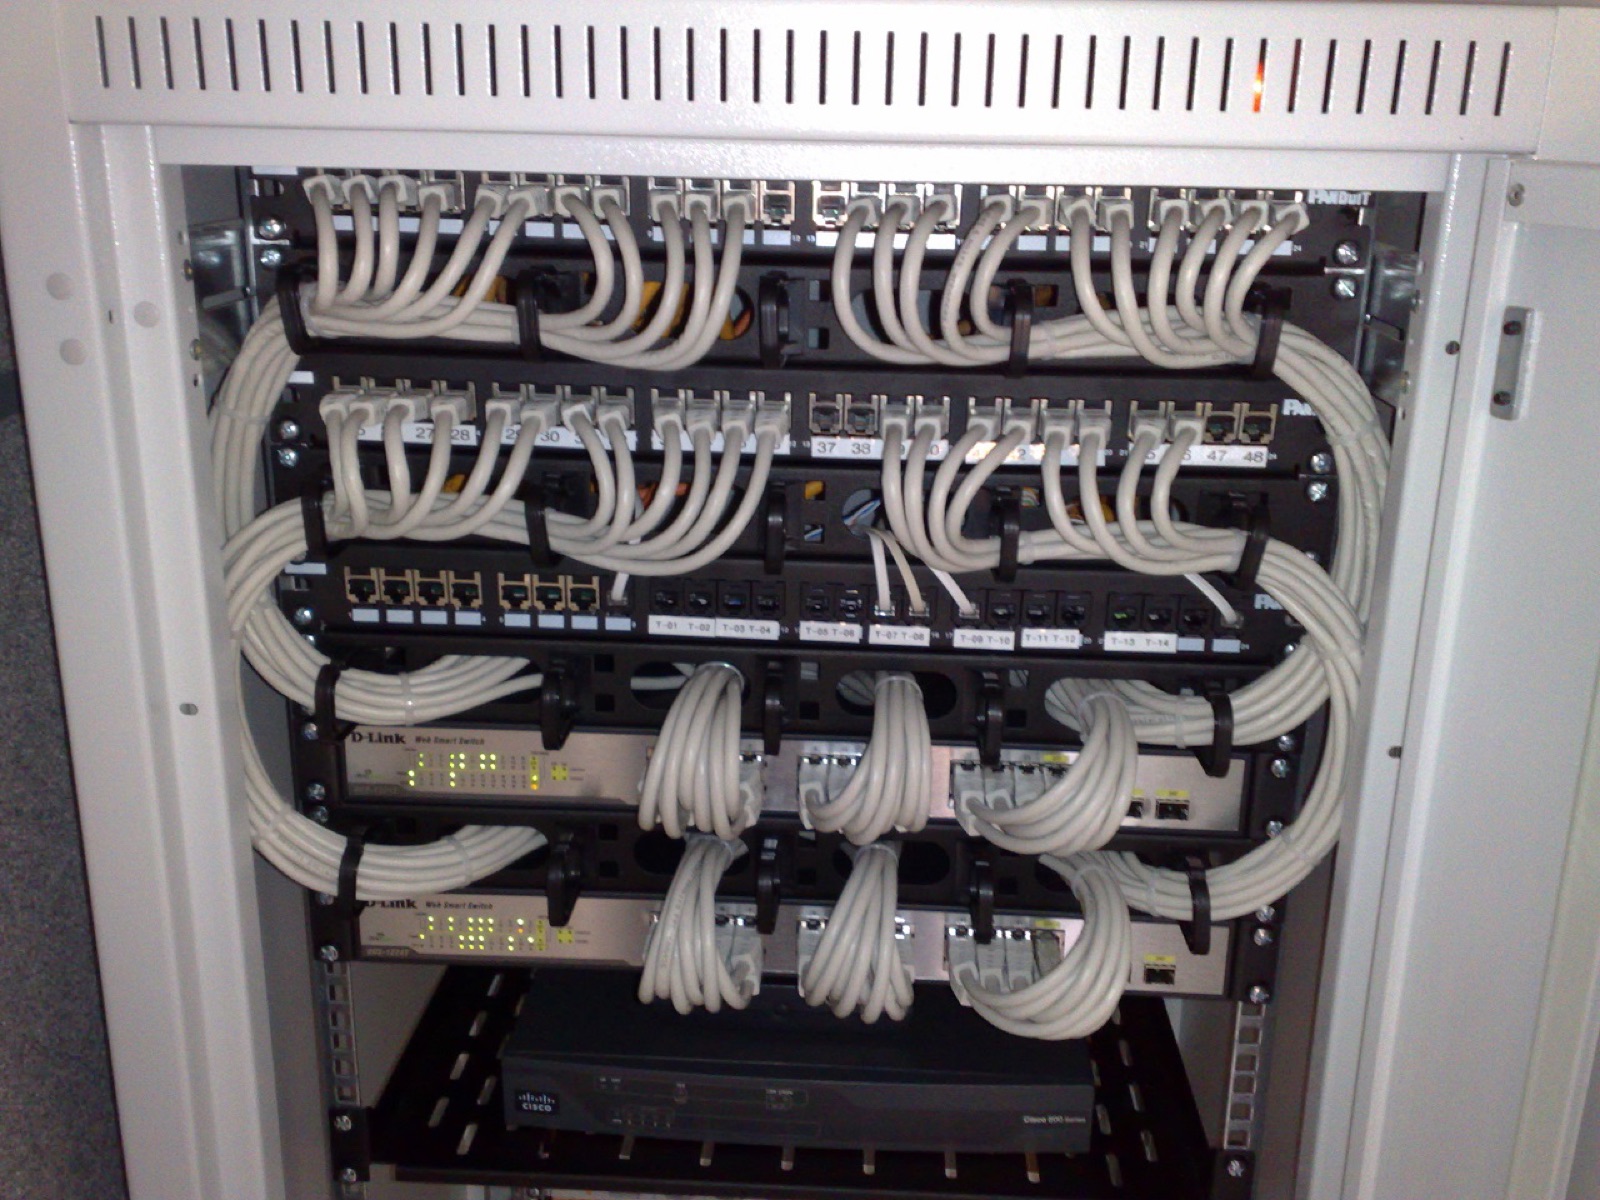
Direct market access (DMA) removes the traditional broker‑dealer “screen” that sits between a trading algorithm and the exchange’s order book. In theory this reduction of latency and of discretionary human intervention gives a strategy a cleaner line of sight to the venue’s price‑time priority queue. In practice the removal of that middle layer also strips away a set of safety nets that have been built into broker‑dealer order‑entry systems for decades. The firm that owns the algorithm now inherits the responsibility for every pre‑trade validation, every post‑trade reconciliation, and every emergency kill‑switch that previously lived in a separate compliance environment.
The problem is therefore not simply a question of speed. It is a question of control: the firm must guarantee that the order it sends is the order it intended, that the order respects the firm‑wide risk limits, and that the firm can intervene instantly if the market moves against the position. When a broker screen is bypassed, the onus shifts from a third‑party to the firm’s own technology stack, its risk‑management team and its operational staff.
A further subtlety is that electronic markets are organised as price‑time priority queues. The value of an order sitting in the queue is a mixture of the expected spread capture, the cost of adverse selection, and the optionality of retaining a place in line. If the algorithm cannot reassess these components continuously, an order that looks profitable at submission may become a liability within milliseconds. The core thesis of this article is that DMA gives the firm unprecedented control over the execution path, but that control is inseparably linked to an expanded operational responsibility that must be managed with rigor.
How the mechanism works, step by step
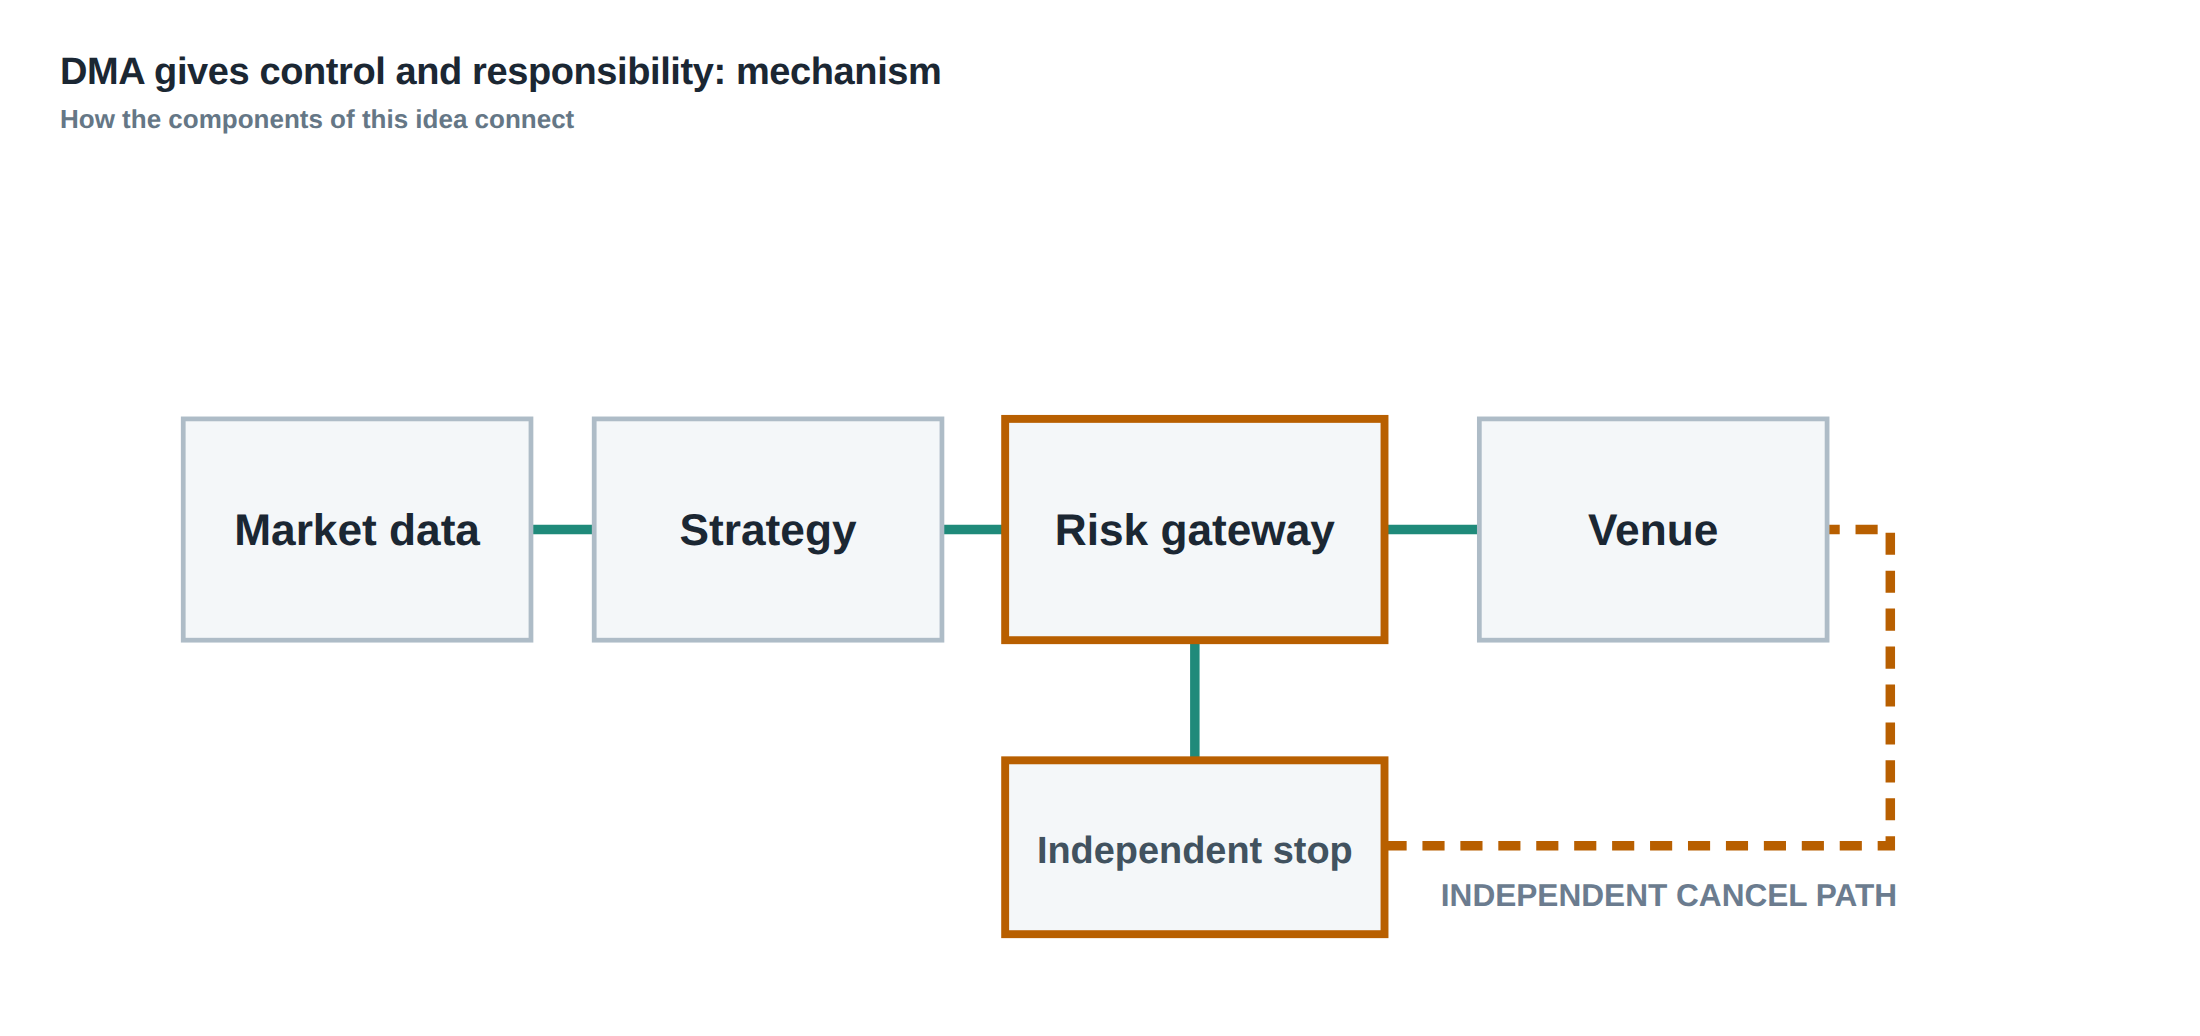
When a strategy decides to trade, it first constructs a trade ticket in memory: a symbol, a side (buy or sell), a price, a quantity and the identifier of the account that will own the position. The ticket then passes through a pre‑trade validation layer that checks the symbol against the firm’s master data, confirms that the side is allowed for the account’s long/short limits, verifies that the price lies within the market‑data‑derived bounds, and ensures that the quantity respects both per‑order and per‑day notional caps.
If the ticket survives these checks, it is handed to the order‑routing engine. The routing engine selects a venue based on latency, liquidity and fee considerations, then formats the order into the exchange’s native protocol (FIX, OUCH, ITCH, etc.). At this point a “kill path” is attached – a low‑latency channel that can cancel the order without traversing the normal strategy process. The order is transmitted over a dedicated line to the exchange’s matching engine, where it enters the price‑time queue.
The exchange immediately acknowledges receipt with an order‑id and a status (accepted, rejected, or pending). The acknowledgement is logged, matched against the outbound ticket, and stored for later reconciliation. Subsequent messages – fills, partial fills, cancellations, or rejects – travel back over the same channel, are parsed by the post‑trade handler, and are used to update the firm’s internal position book and risk engine. Throughout this loop the firm must maintain a tight feedback loop so that any deviation from the expected state can be acted upon within a few microseconds.
A worked example with real numbers
Consider a statistical arbitrage strategy that monitors the EUR/USD and GBP/USD cross‑rates. At 09:30:12.345 UTC the algorithm detects a 0.5 bp deviation from its historical spread and decides to sell 1 million EUR at 1.0950 while buying the equivalent GBP at 1.3950. The notional of the EUR trade is €1 million × 1.0950 = $1 185 000, and the GBP trade is £1 million × 1.3950 = $1 395 000. The firm’s risk limit for any single order is $2 million, so both legs are under the per‑order cap. The fat‑finger rule is set at 5 % of the average daily volume; for EUR/USD the average daily volume is $100 billion, so the maximum order size is $5 billion – well above the $1.2 million we intend. Frequency limits allow a maximum of 20 orders per second; the algorithm will issue only two orders, so the limit is respected.
The validation layer checks that the EUR/USD symbol is active, that the account is authorised for short EUR positions, that the price 1.0950 is within the market‑data‑derived band of 1.0945‑1.0955, and that the quantity of 1 million does not breach the per‑account notional of $10 million. All checks pass, and the order is sent via a DMA line to the primary venue, which acknowledges the order at 09:30:12.347 UTC with order‑id 874321.
Within 1.2 ms the exchange matches the sell order against a resting buy at 1.0950, generating a full fill. The fill message arrives at 09:30:12.349 UTC, the post‑trade handler updates the position book, and the risk engine confirms that the net exposure remains within the $5 million aggregate limit. The kill path is never invoked, but it remains ready – a separate TCP socket that could issue a cancel message in under 300 µs if the market moved against the position. This example shows that while the broker screen is absent, every validation, limit and acknowledgement is still present, now owned by the firm.
Where it breaks in live markets
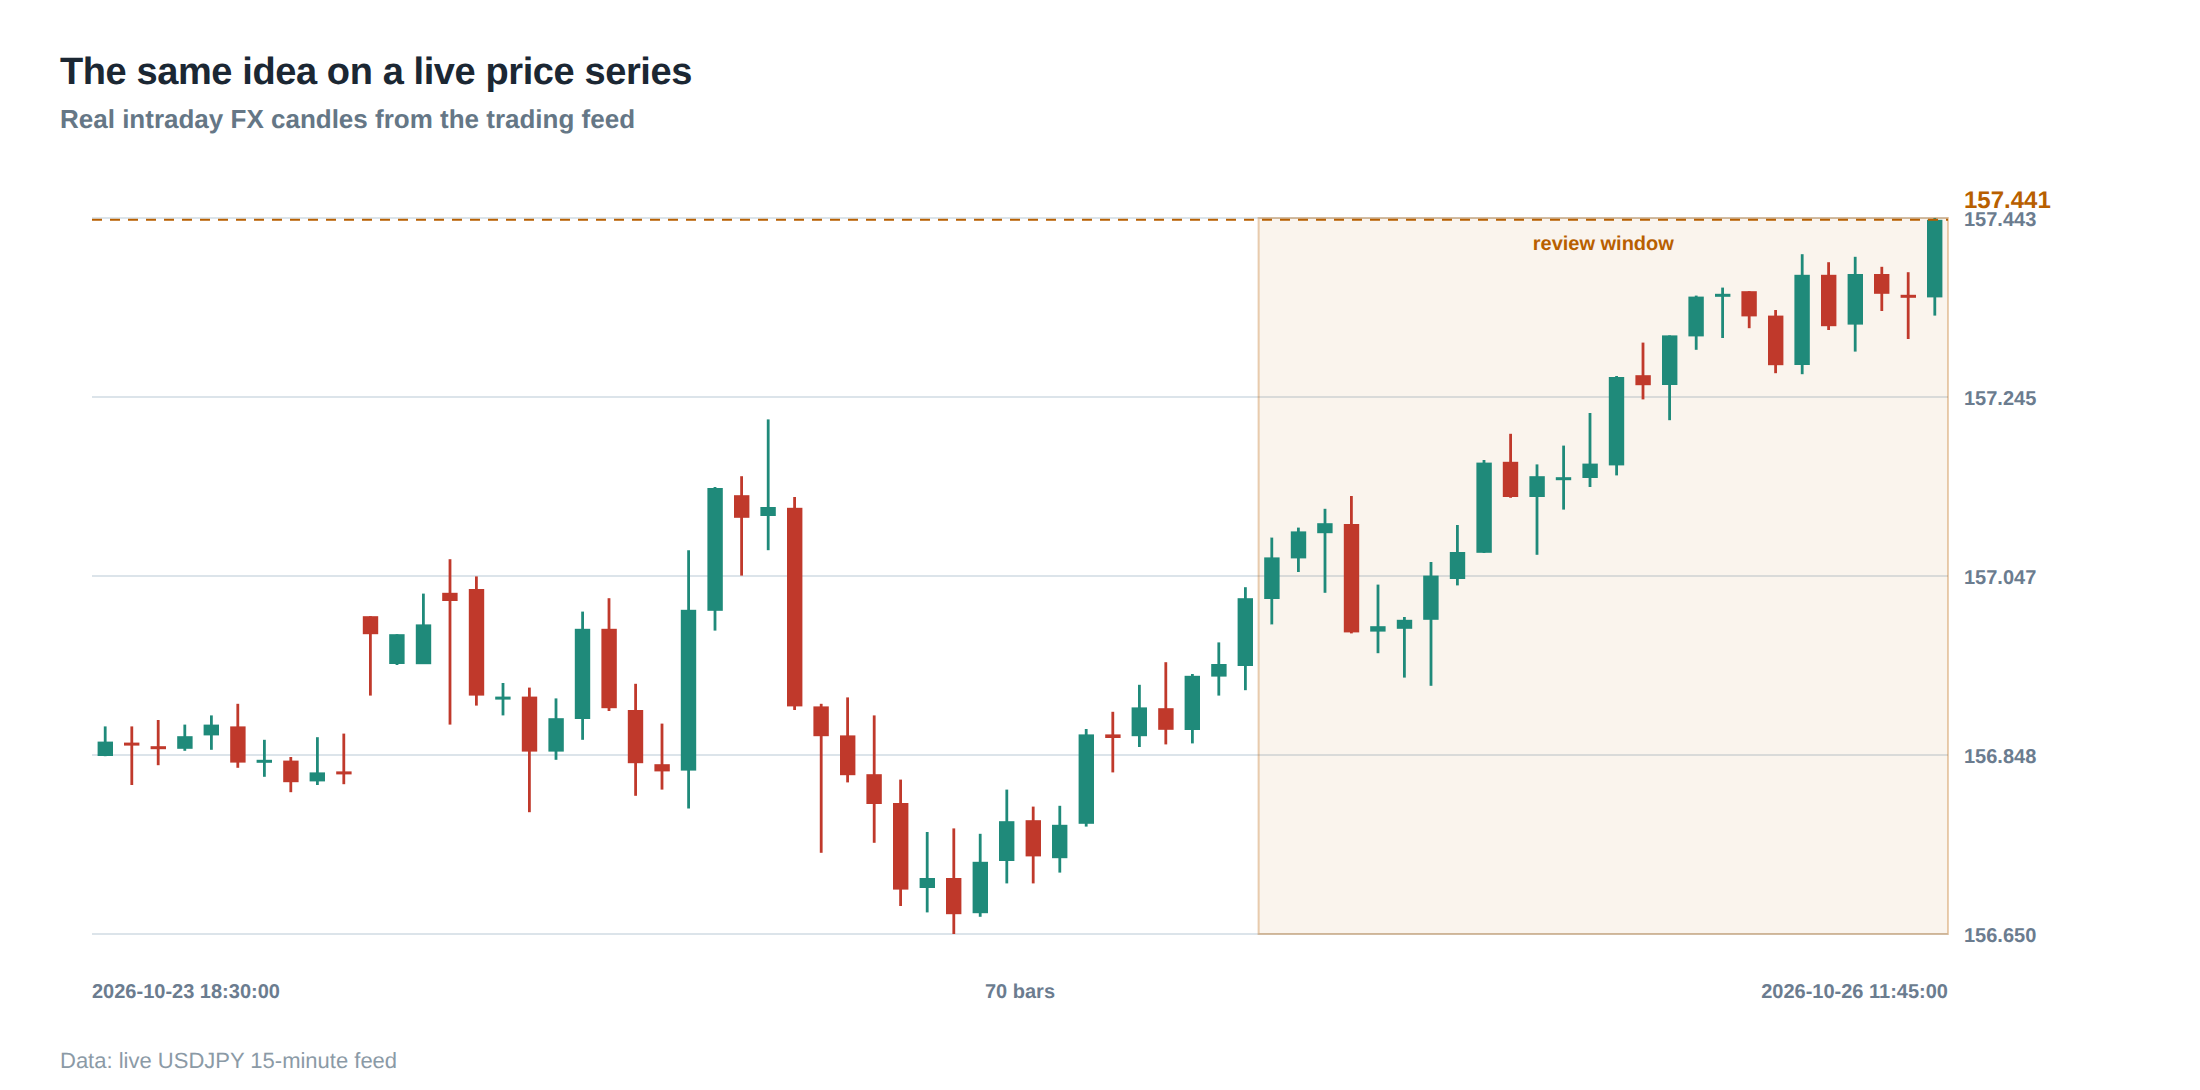
The elegance of the DMA chain collapses as soon as one component fails to honour its contract. A common failure mode is a stale master‑data table: if the symbol list is not refreshed after a corporate action, an order may be routed to a defunct contract, generating a hard reject that must be caught and re‑issued. Another failure is the latency spike in the kill path; if the dedicated cancel channel is congested, the firm may be unable to withdraw an order before the market price moves, turning a modest adverse‑selection cost into a full‑blown slippage event.
In high‑frequency environments the frequency limit can be inadvertently breached when a burst of market data triggers many parallel instances of the same strategy. The validation layer may allow the first few orders, but subsequent ones can be throttled by the exchange, resulting in a cascade of rejected messages that need to be reconciled. Duplicate‑order detection is also critical: without a robust de‑duplication check, a network retransmission can cause the same order to be entered twice, inflating exposure beyond the intended notional.
Finally, the reconciliation process can break down if acknowledgements are lost or delayed. An order that the firm believes was cancelled may have been accepted on the exchange, leaving an orphan position that the risk engine cannot see until the next batch reconciliation. In live markets these gaps become costly because they are not isolated incidents; they compound across the many strategies that a prop desk runs simultaneously.
The operating path, stage by stage
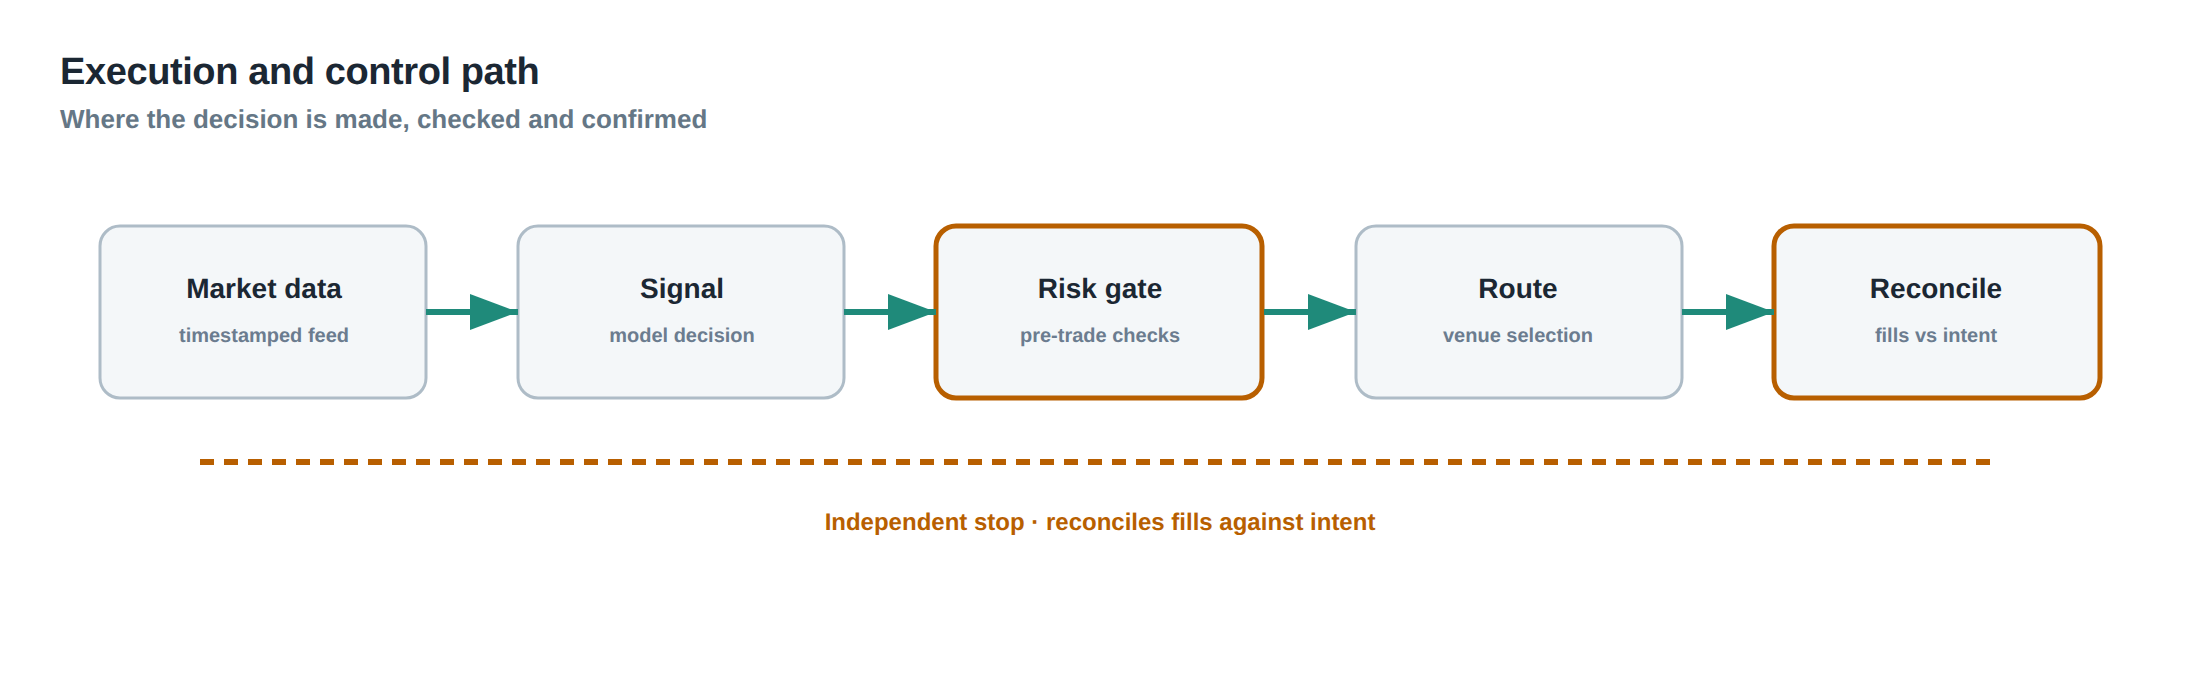
The first stage is data ingestion. Market data feeds are normalised, time‑stamped to sub‑microsecond precision, and stored in a ring buffer that the strategy reads from. The second stage is signal generation, where the algorithm consumes the normalised data and decides on a trade. The third stage is ticket creation, where the trade parameters are assembled into a structured object. The fourth stage is pre‑trade validation, which checks symbol integrity, side eligibility, price bounds, quantity limits, and account permissions.
The fifth stage is order routing, where the ticket is mapped to a venue, encoded into the exchange’s protocol, and dispatched over a low‑latency DMA link. The sixth stage is the kill path, a parallel channel that can inject a cancel message at any point before the order is fully executed. The seventh stage is the acknowledgement handling, where the exchange’s response is matched to the outbound ticket and logged. The eighth stage is post‑trade processing, where fills, partial fills, and rejects are reconciled with the internal position book, and risk metrics are updated. The final stage is the audit trail, a tamper‑evident store that records every state transition for regulatory and forensic review.
Each stage must be independently testable and must expose health metrics that can be monitored in real time. If any stage stalls, the downstream stages cannot progress, and the entire DMA chain collapses. Therefore the architecture is deliberately layered, with clear hand‑off points that can be instrumented for latency and error‑rate monitoring.
Controls that act before the damage
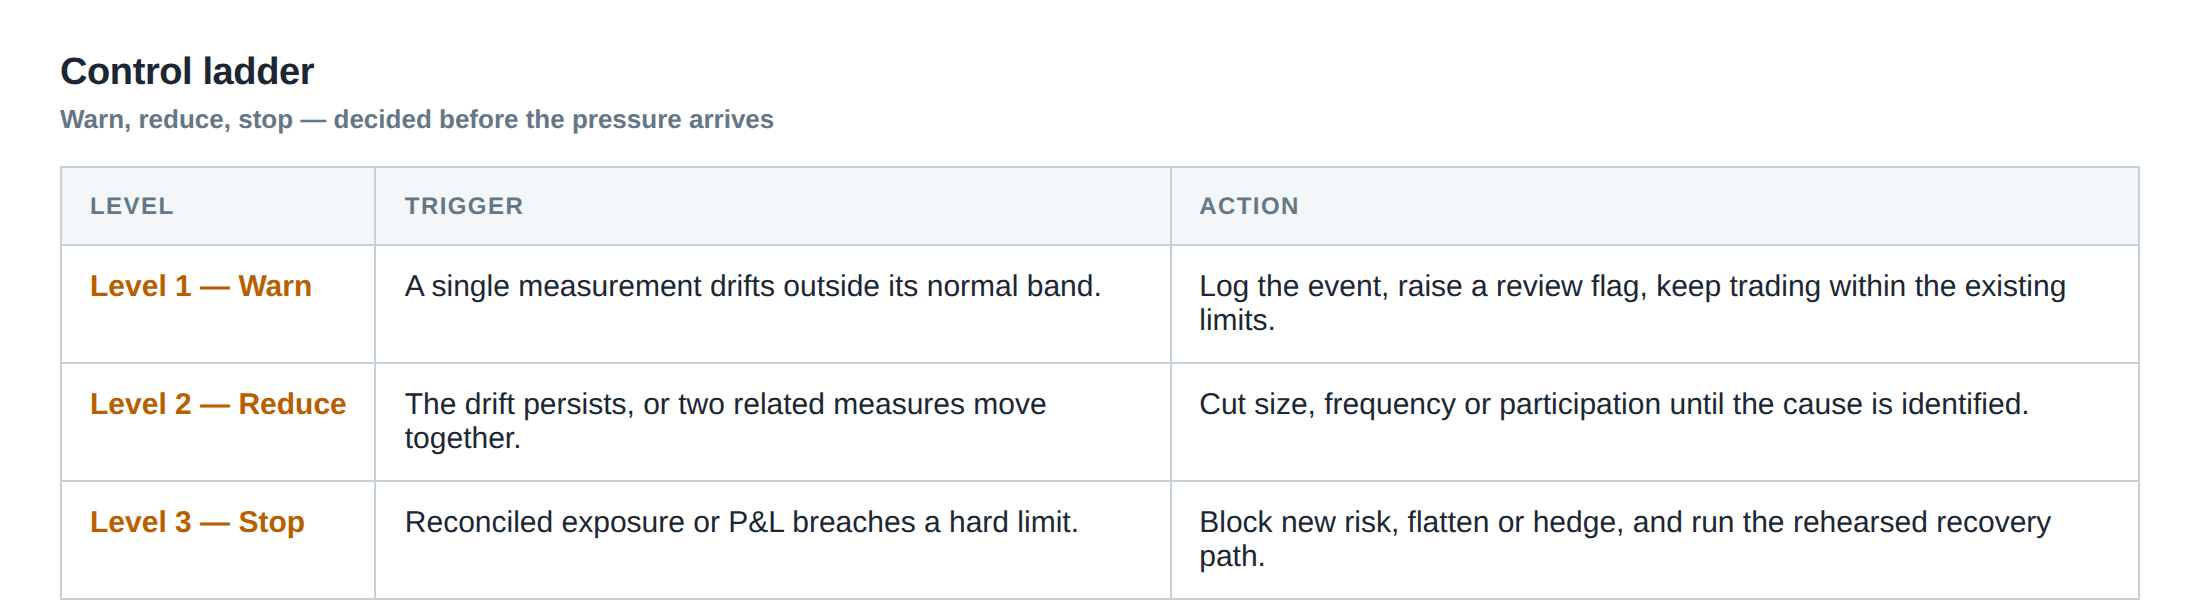
Before an order ever leaves the firm’s datacentre, a suite of pre‑trade controls must be applied. The fat‑finger control caps the absolute dollar value of any single order at a fraction of the average daily volume; this prevents accidental orders that would move the market or breach exchange limits. Notional limits enforce a ceiling on the product of price and quantity, expressed in the account’s base currency, ensuring that a single trade cannot dominate the portfolio’s risk profile.
Frequency controls monitor the rate at which orders are emitted per strategy, per account, and per venue, throttling submissions that exceed a pre‑defined threshold. Duplicate‑order detection uses a hash of the ticket’s key fields (symbol, side, price, quantity, timestamp) to recognise retransmissions caused by network glitches, discarding the second instance before it reaches the exchange.
Another critical control is the independent supervision layer: a separate process that receives a copy of every outbound ticket, re‑applies the same validation rules, and raises an alarm if any discrepancy is detected. This supervision does not intervene in the normal order flow but provides an out‑of‑band safety net that can trigger a manual kill if the primary kill path is compromised.
All these controls are enforced by code that is version‑controlled, peer‑reviewed, and subject to daily regression testing. The goal is to make the pre‑trade gate as impermeable as the broker screen that has been removed, while retaining the flexibility that DMA offers.
How to measure whether it is working
The primary metric is the latency distribution of each stage: from ticket creation to acknowledgement, from kill‑path activation to order cancellation, and from fill receipt to position‑book update. A healthy DMA stack shows sub‑microsecond jitter on the kill path and a tight 95th‑percentile latency on the acknowledgement channel.
Second, the rate of rejected or errored orders is tracked. A sudden rise in hard rejects, duplicate‑order flags, or frequency‑limit violations signals a breakdown in the validation or supervision layers. The proportion of orders that trigger the independent supervision alarm versus those that pass silently provides a leading indicator of control drift.
Third, reconciliation accuracy is measured by the daily “gap” between the exchange‑provided order‑book snapshot and the firm’s internal book. A residual mismatch of more than a few basis points of notional indicates a failure in acknowledgement or fill processing.
Finally, the effectiveness of the kill path is quantified by the “time‑to‑kill” metric: the elapsed time between a market‑triggered kill decision and the receipt of a cancellation acknowledgement. Benchmarks of under 300 µs are typical for high‑frequency desks; anything above 1 ms is a red flag that the emergency channel may be congested or mis‑routed. Continuous monitoring of these metrics, coupled with automated alerts, ensures that the DMA system remains within the risk envelope defined by the firm.
The portfolio view
From a portfolio perspective, DMA changes the way execution risk is modelled. The removal of the broker screen eliminates a source of latency variance but introduces a new source of operational variance: the probability that a pre‑trade control fails or that a kill path does not fire. Portfolio‑level risk models therefore need to incorporate an “operational‑failure” component, calibrated from the historical frequency of control breaches, kill‑path delays, and reconciliation gaps.
The impact on expected transaction cost is also altered. Spread capture is still a function of queue position, but the cost of adverse selection now includes the expected loss from a possible control failure. For example, if the historical probability of a kill‑path delay exceeding 500 µs is 0.2 %, the model should add the expected slippage from that tail event to the overall cost estimate.
Liquidity‑allocation decisions must also respect the firm‑wide notional and frequency caps that are now enforced at the DMA layer. A strategy that previously relied on a broker’s discretionary “soft” limits must now be explicitly aware of the hard caps coded into the pre‑trade engine. This awareness can be built into the optimisation routine that determines order size, timing and venue choice, ensuring that the algorithm does not propose orders that will be automatically rejected.
In practice, the portfolio manager monitors the aggregate utilisation of the DMA limits, the health of the kill path, and the reconciliation error rate as part of the daily risk dashboard. Any deviation from the expected operational baseline prompts a review of the underlying code, the network topology, or the market‑data feed integrity. By treating operational risk as a first‑order input, the desk can preserve the speed advantage of DMA without sacrificing the safety net that a broker screen traditionally provided.
Will your firm’s operational controls be robust enough to let you reap the speed benefits of direct market access without exposing yourself to hidden execution risk?
About the research behind this lesson
The seminar frames electronic markets as price-time-priority queues. It separates queue value into spread capture versus adverse-selection cost and the option value of retaining a place in line.
Applied to this lesson: An order lifetime therefore cannot be based on elapsed time alone: the system must reassess whether its queue position, expected spread and adverse-selection risk still justify keeping the order alive.
Two live systems, one desk
PULSE-X — power-packed HFT: high-frequency momentum on XAUUSD and EURUSD. System details · Live account
NIC-X — ultra-low drawdown: displaced-print arbitrage for large capital. System details · Live account
Start now: leave your email and request a free trial — we will send the pricing, the connection route and the trial terms. Pricing
Live chat and updates: Telegram @xtrskhft
Source: High-Frequency Trading and Modern Market Microstructure
Educational content only. Trading leveraged products involves risk.
Chat with XTRSK
Chat ready
Start a chat and the XTRSK team will be notified immediately.