XCore HFT / Trading Lab
Order type is a risk decision
Quantitative execution, market-microstructure, and risk-control research from XTRSK.
What this problem really is
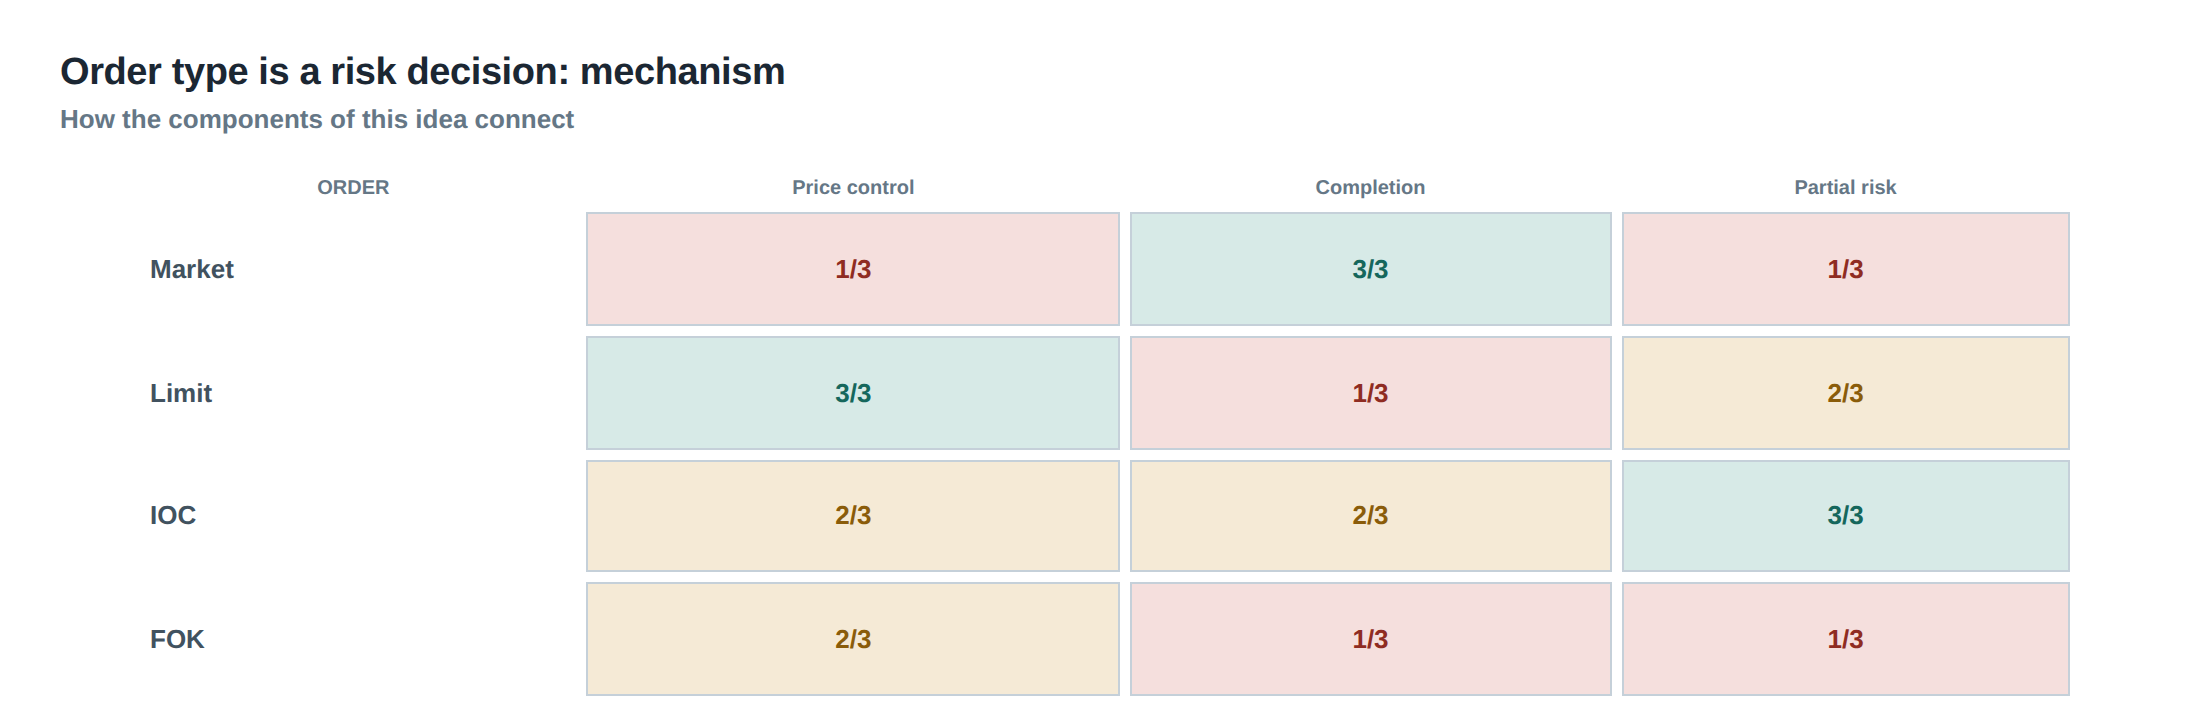
The choice of order instruction is not a peripheral implementation detail; it is a primary risk decision that determines whether a signal is turned into realised P&L or disappears as a missed opportunity. A market order guarantees execution but surrenders price certainty; a limit order preserves price but may never fill, exposing the strategy to information leakage and opportunity cost. Immediate‑or‑cancel (IOC) and fill‑or‑kill (FOK) sit between the extremes, trading execution certainty against the risk of partial fills or outright rejection. When a signal arrives, the trader must evaluate the urgency of the trade, the depth available at the best price, and the tolerance for residual quantity. The decision therefore becomes a balancing act between the expected spread capture, the adverse‑selection cost of standing in the queue, and the option value of retaining a place in line.
In practice the problem is amplified by the fact that electronic markets operate as price‑time‑priority queues. Each order contributes to a virtual line that can be valued in two ways: the immediate profit that can be earned by crossing the spread, and the hidden cost of being exposed to better‑priced orders that arrive later. The decision to keep an order alive cannot be based solely on how long it has been resting; it must be continuously reassessed against the evolving queue position, the likelihood of adverse selection, and the residual risk of the unfilled portion. Ignoring this dynamic leads to either over‑aggressive market orders that bleed slippage, or over‑cautious limit orders that leave capital idle.
How the mechanism works, step by step
When a signal is generated, the execution engine first classifies its urgency. A high‑frequency arbitrage signal that is expected to decay within a few milliseconds will typically be routed to a market or FOK instruction, because any delay in price is more damaging than a modest execution cost. Conversely, a statistical‑edge signal that is expected to materialise over seconds or minutes can afford a limit order, provided the expected spread capture outweighs the probability of non‑execution.
The next step is to probe the depth of the order book. The engine queries the best‑bid and best‑ask quantities, calculates the cumulative volume required to fill the target size, and evaluates the price impact of each possible instruction. If the required volume exceeds the displayed depth at the quoted price, an IOC may be chosen to take whatever is immediately available, while a FOK would reject the trade entirely if the full size cannot be matched instantly.
Finally, the system defines the acceptable partial‑fill behaviour. For a strategy that can scale down proportionally, a partial fill is tolerable and the order may be left open with a reduced target size. For a position‑sensitive strategy, any residual quantity may be deemed a risk, prompting an immediate cancel or a switch to a more aggressive instruction. The execution logic records the outcome – filled, partially filled, rejected, or cancelled – and feeds it back into the risk monitor for real‑time adjustment.
A worked example with real numbers
Consider a futures contract where the best ask is 10 000 pts with 250 contracts available, and the second‑level ask is 10 001 pts with an additional 500 contracts. The trading signal calls for a buy of 600 contracts, and the model predicts a mean reversion profit of 2 pts per contract if execution occurs at 10 000 pts.
A market order would guarantee the 600 contracts but would sweep the book, paying 250 × 10 000 + 350 × 10 001 = 6 000 000 + 3 503 500 = 9 503 500 pts, an average price of 10 005.83 pts. The realised profit would be (2 pts × 600) − (5.83 pts × 600) ≈ ‑2 298 pts, a clear loss caused by price impact.
A limit order placed at 10 000 pts with a FOK instruction would be rejected because the displayed depth (250) is insufficient for the full 600‑contract fill. The order would therefore generate a reject outcome, and the trader would miss the opportunity entirely. The cost of the missed trade is the expected profit of 2 pts × 600 = 1 200 pts, plus the opportunity cost of not being in the market when the signal decays.
An IOC placed at 10 000 pts would take the 250 contracts instantly and cancel the remainder. The filled portion would cost 2 500 000 pts, achieving a profit of (2 pts × 250) − (0 pts × 250) = 500 pts. The unfilled 350 contracts would be re‑evaluated; if the model still predicts a positive edge after the partial execution, a new limit order could be placed at 10 001 pts. In this scenario the IOC avoids the adverse‑selection loss of the market order while still capturing a portion of the expected profit, and the reject‑to‑cancel ratio remains low.
The numbers illustrate how the same signal can produce three very different outcomes – a loss, a total miss, or a partial gain – solely by varying the order instruction.
Where it breaks in live markets
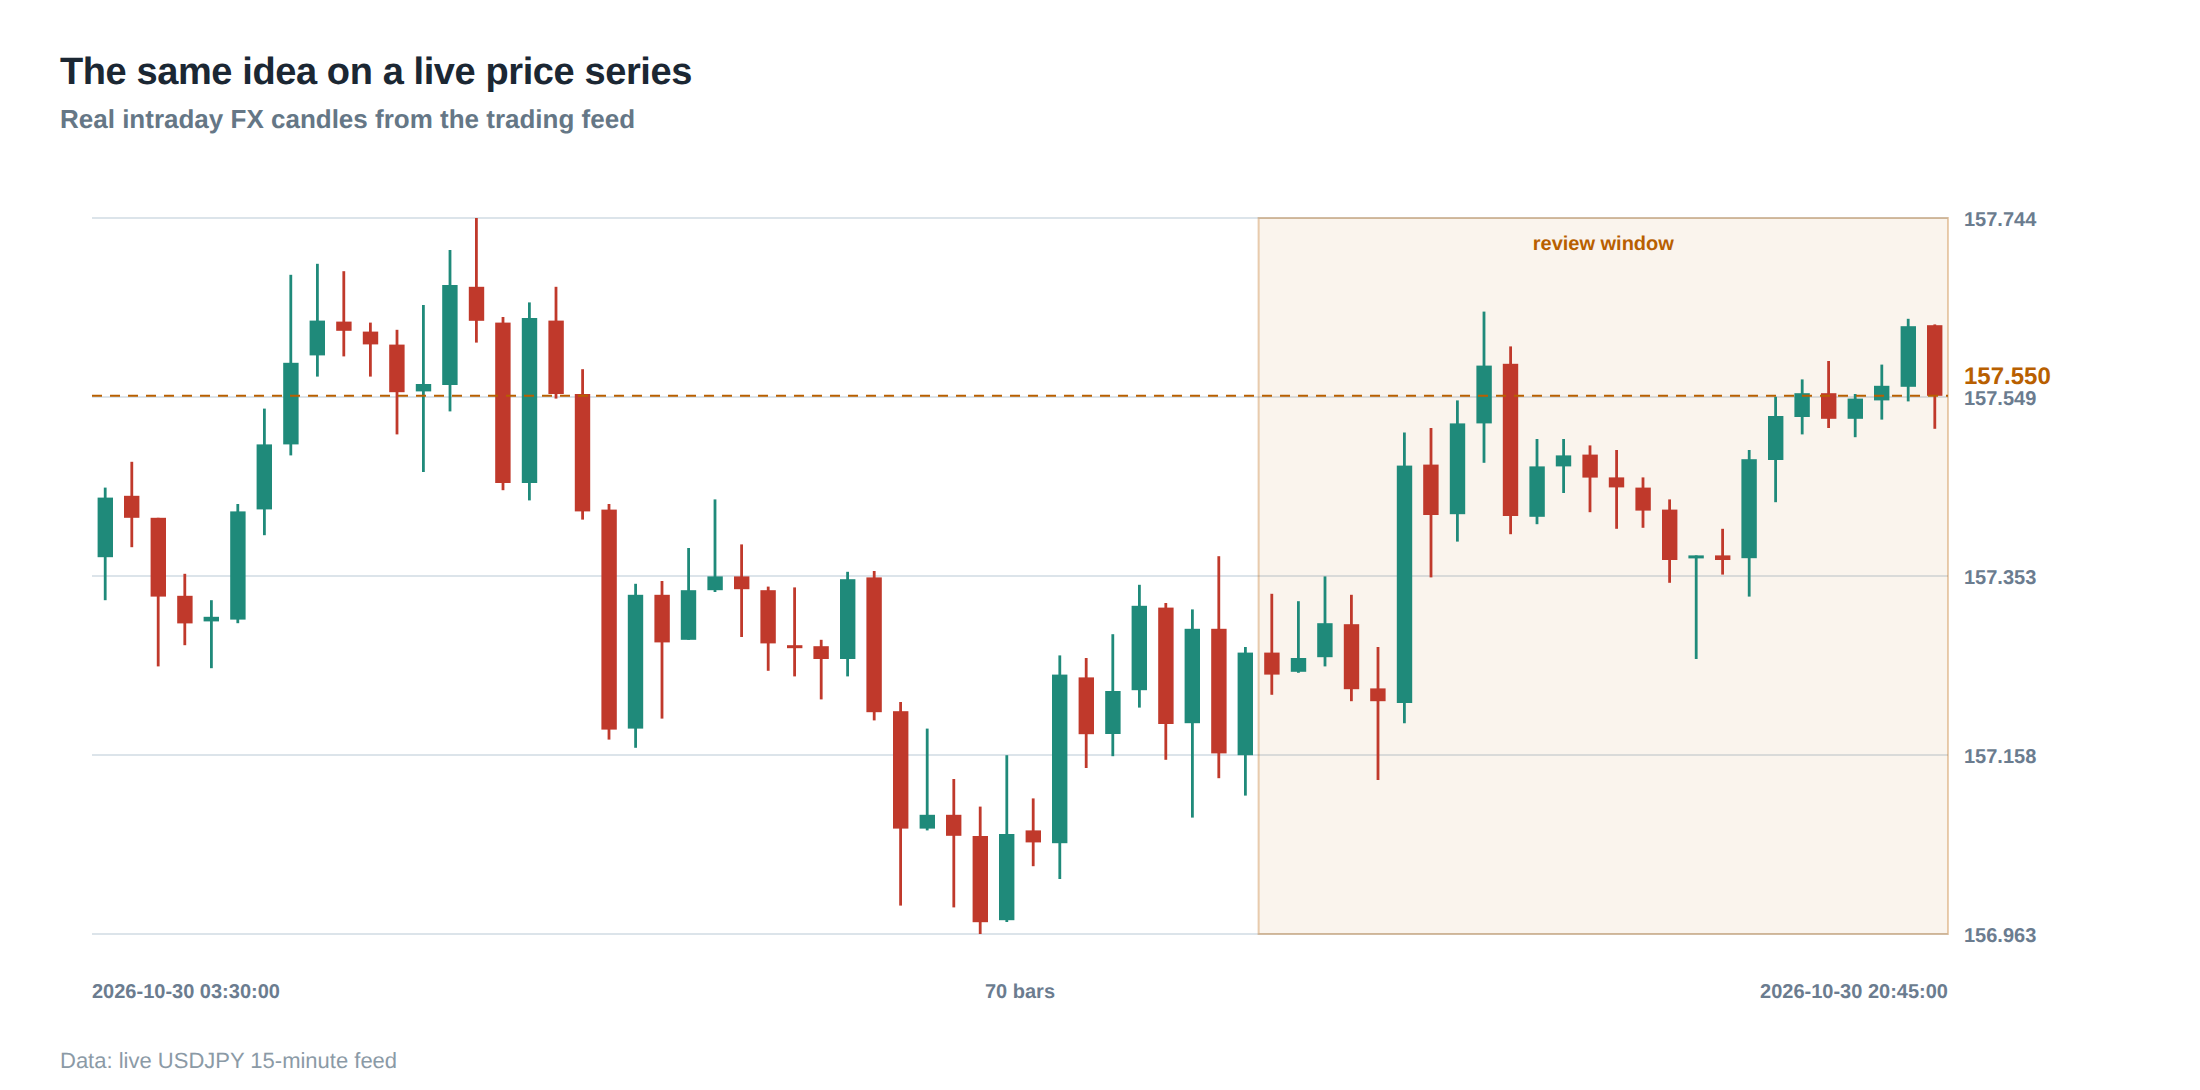
In a live order‑driven market, depth can evaporate within microseconds as hidden liquidity surfaces or large participants slice their orders. An instruction that appeared safe a few milliseconds earlier may become hazardous the moment a new aggressive order arrives. The most common failure mode is the reliance on a single default order type for an entire regime, such as always using limit orders for “medium‑frequency” signals. When market conditions shift – for example, during a news‑driven spike – the queue position deteriorates rapidly, and the limit order may sit idle while the edge evaporates.
Another breakdown occurs when the execution engine does not account for partial‑fill tolerance. A strategy that cannot scale down may inadvertently accept an IOC that only fills a fraction of the intended size, leaving a residual exposure that the risk manager has not priced. The residual position can be forced into the market later at a worse price, turning a seemingly benign partial fill into a hidden loss.
The operating path, stage by stage
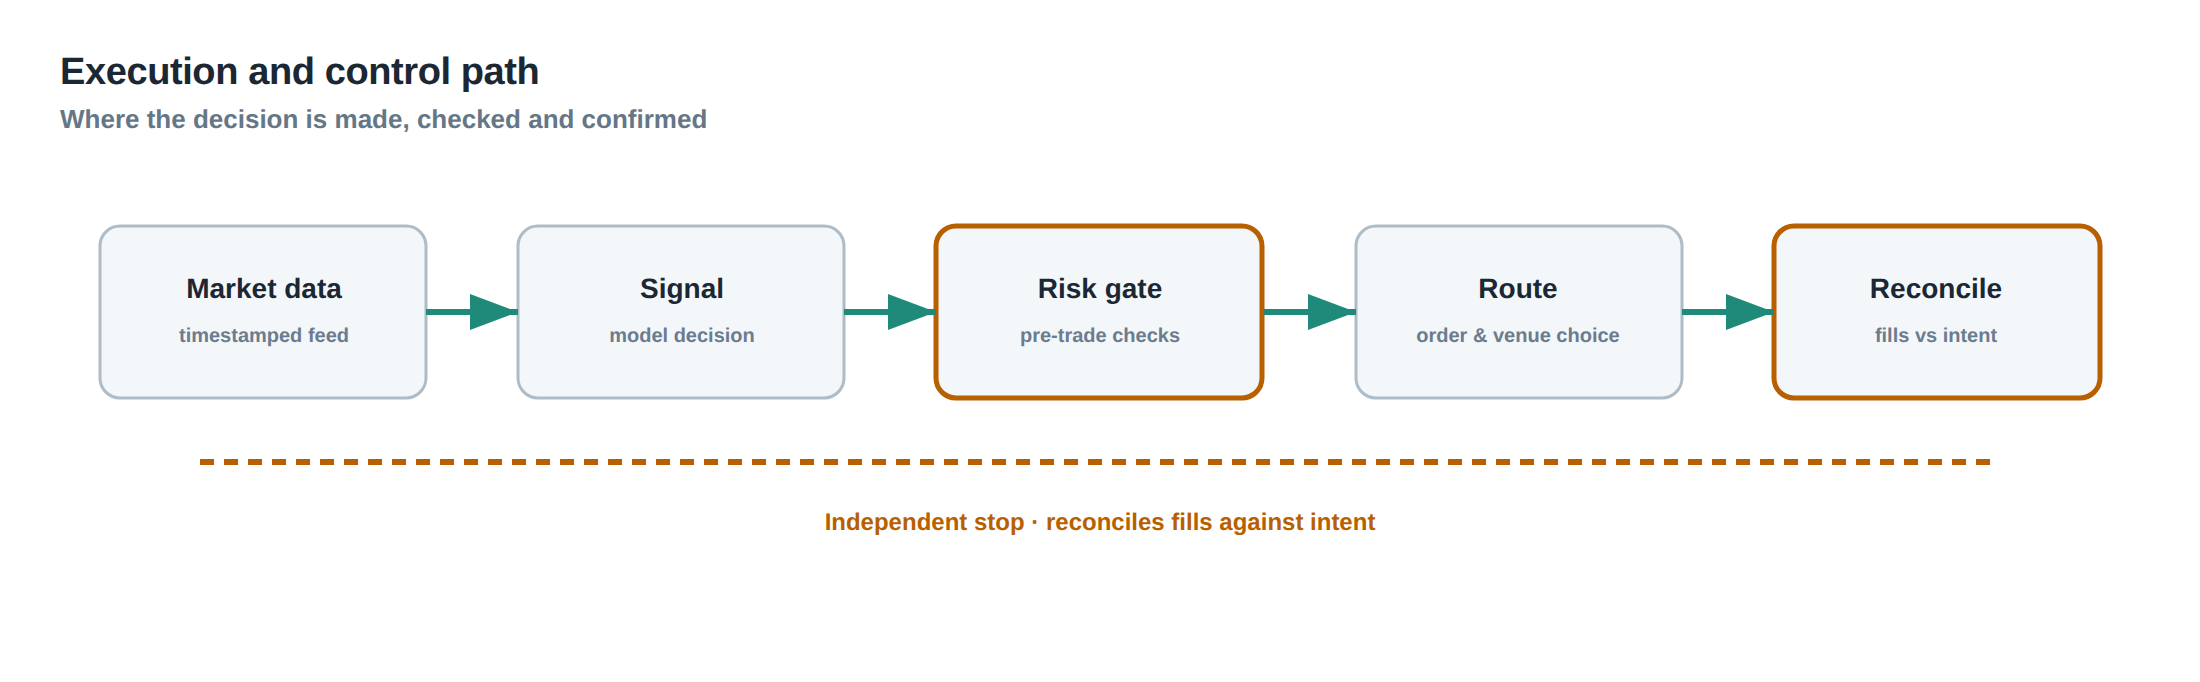
The first stage is signal classification, where the engine tags each trade with a urgency score derived from the expected decay horizon and the statistical significance of the edge. The second stage is depth assessment, which queries the market data feed for the best‑price cumulative volume and calculates the execution probability for each instruction type. The third stage is instruction selection, where the engine weighs the trade‑off between execution certainty and price certainty, applying a decision matrix that incorporates the signal urgency, depth, and partial‑fill tolerance.
The fourth stage is order submission, where the chosen instruction – market, limit, IOC or FOK – is sent to the venue with a time‑in‑force parameter that reflects the acceptable lifetime. The fifth stage is outcome monitoring, which records fills, partial fills, rejects, and cancellations in real time, updating the internal risk metrics. The final stage is feedback, where the observed outcome influences the next iteration of the decision matrix, allowing the system to adapt to changing market microstructure.
Controls that act before the damage
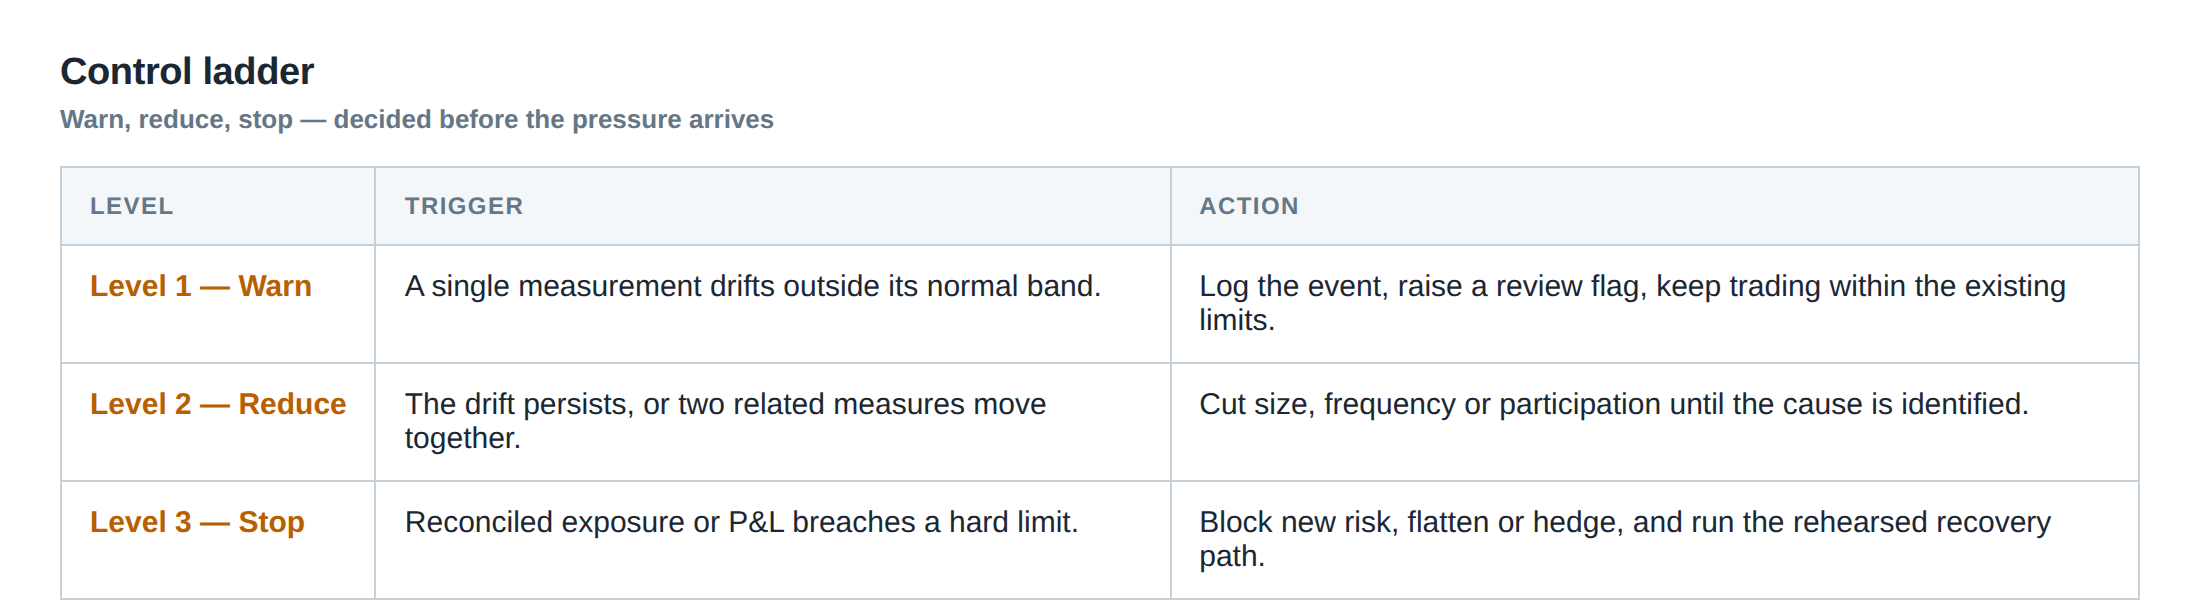
A pre‑trade control checks the maximum acceptable adverse‑selection cost by estimating the probability that a better‑priced order will arrive while the order is resting. If the estimated cost exceeds a pre‑defined threshold, the engine automatically upgrades the instruction from limit to IOC or market, thereby reducing the exposure to queue‑position risk.
A second control validates the partial‑fill policy against the strategy’s capital allocation rules. If the residual quantity after an IOC exceeds the permitted deviation from the target size, the engine either cancels the remainder or issues a new order with a tighter price limit. This guard prevents the accumulation of stray positions that could breach the desk’s risk limits.
How to measure whether it is working
The primary metric is the fill‑to‑reject ratio, calculated as the number of successful executions divided by the number of orders that were rejected or cancelled before any fill. A high ratio indicates that the instruction selection is aligned with market depth, while a low ratio signals over‑aggressive or mis‑timed orders.
Secondary metrics include the average execution price deviation from the mid‑price at the moment of signal generation, and the realised opportunity cost measured as the difference between the expected profit of a filled trade and the profit actually earned when an order is partially filled or rejected. Tracking these figures across different order types reveals which instruction delivers the best risk‑adjusted return for each signal class.
The portfolio view
From a portfolio perspective, the aggregate effect of order‑type decisions manifests as a drift in realised versus theoretical Sharpe ratio. When a desk systematically over‑uses market orders, the realised spread capture shrinks and slippage inflates, dragging down the risk‑adjusted return. Conversely, an over‑reliance on limit orders can lead to a high proportion of missed trades, reducing turnover and leaving the capital under‑utilised, which also depresses the Sharpe.
Balancing the mix of instructions across the portfolio therefore becomes a portfolio‑level optimisation problem. Each strategy contributes a weight to the overall order‑type distribution, and the desk must monitor the marginal contribution of each instruction to the portfolio’s total P&L volatility. By adjusting the instruction mix in response to observed reject‑to‑cancel ratios and partial‑fill costs, the desk can maintain a stable risk‑adjusted performance even as market microstructure evolves.
Do you currently review the instruction choice for each signal class, or do you rely on a single default order type across the board?
About the research behind this lesson
The seminar frames electronic markets as price-time-priority queues. It separates queue value into spread capture versus adverse-selection cost and the option value of retaining a place in line.
Applied to this lesson: An order lifetime therefore cannot be based on elapsed time alone: the system must reassess whether its queue position, expected spread and adverse-selection risk still justify keeping the order alive.
Two live systems, one desk
PULSE-X — power-packed HFT: high-frequency momentum on XAUUSD and EURUSD. System details · Live account
NIC-X — ultra-low drawdown: displaced-print arbitrage for large capital. System details · Live account
Start now: leave your email and request a free trial — we will send the pricing, the connection route and the trial terms. Pricing
Join the market discussion: Telegram @squawklive
Source: High-Frequency Trading and Modern Market Microstructure
Educational content only. Trading leveraged products involves risk.
Chat with XTRSK
Chat ready
Start a chat and the XTRSK team will be notified immediately.