XCore HFT / Trading Lab
Loss limits need a hierarchy
Quantitative execution, market-microstructure, and risk-control research from XTRSK.
What this problem really is
In a proprietary trading environment the temptation to rely on a single‑order stop is strong. The stop appears to give an immediate, mechanical guard against an adverse move, and the trader can see the price level at which the order will be liquidated. In practice, however, the stop is only one rung on a much taller ladder of risk controls. When the stop is treated as the sole defence, the hierarchy that should protect the strategy, the account and ultimately the firm collapses. The result is a cascade where a cluster of trades, each respecting its own per‑order limit, together generate a realised loss that far exceeds the daily risk appetite. The breach is not a statistical outlier; it is a structural weakness that arises from the absence of coordinated, multi‑level limits that incorporate both realised and unrealised profit and loss, fees, financing charges and any currency conversion effects.
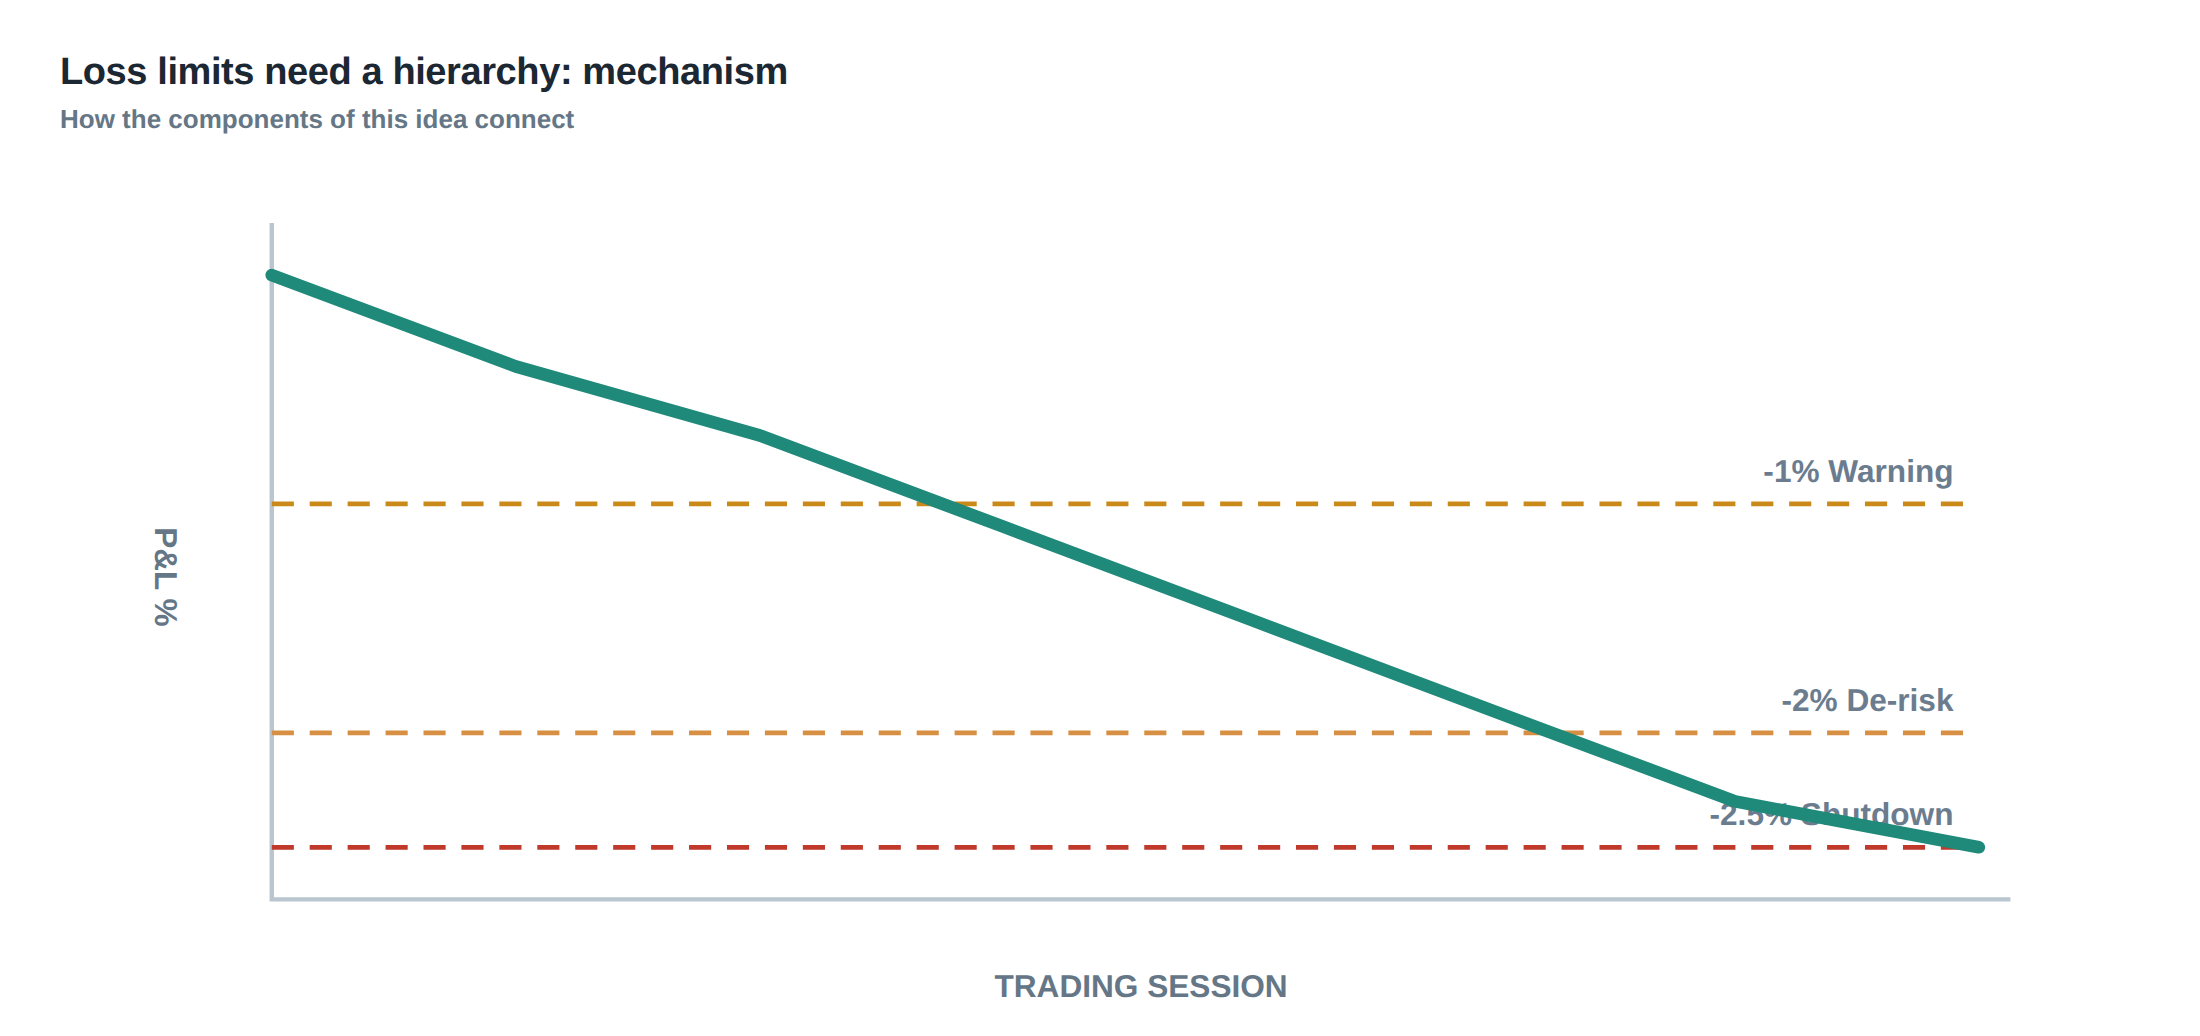
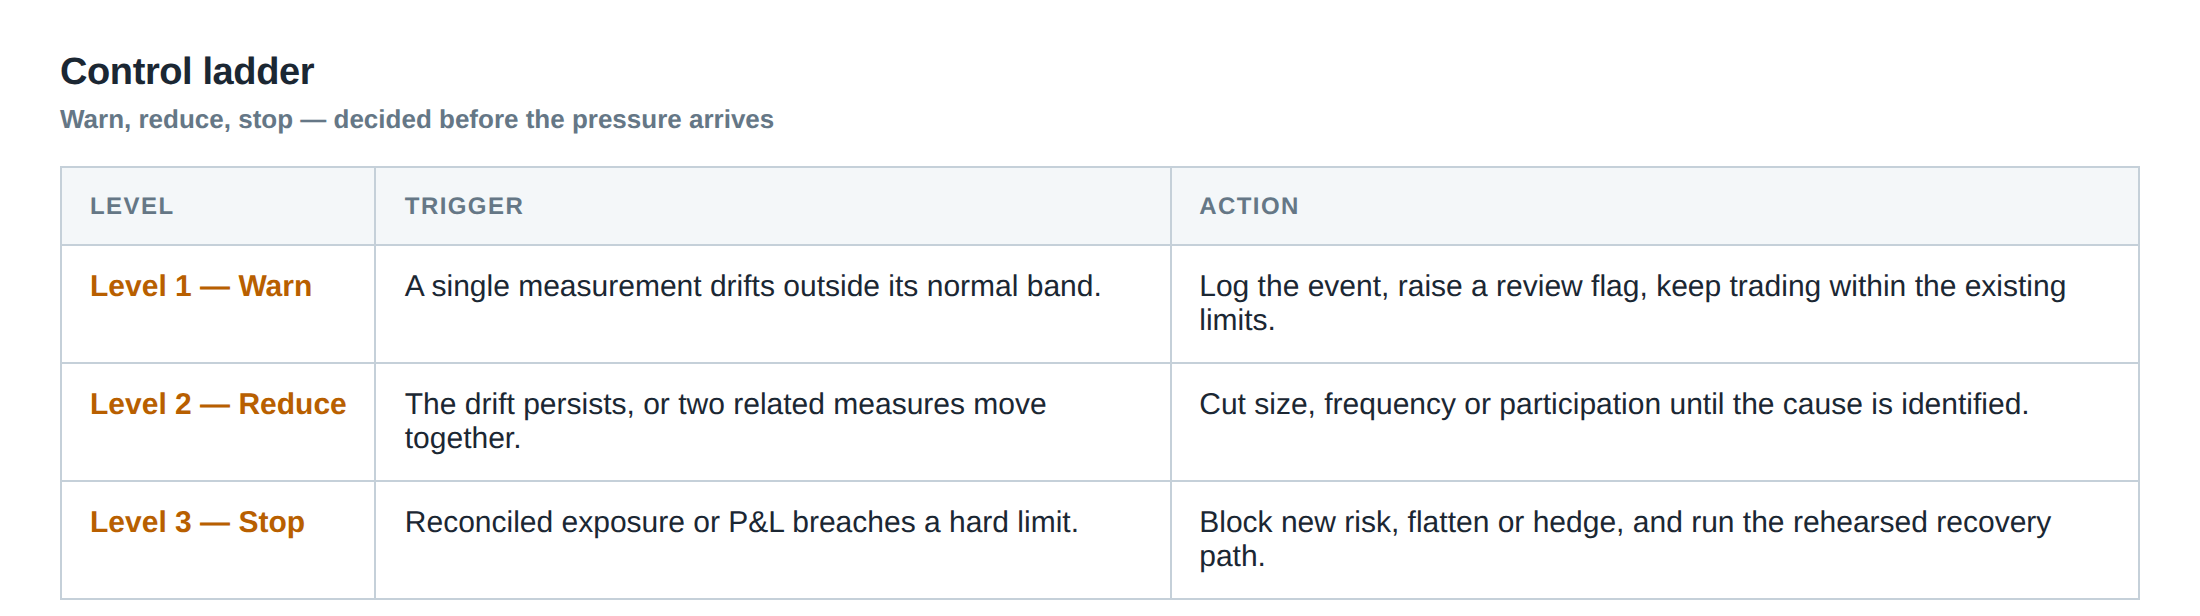
The hierarchy can be visualised as a series of concentric rings. The innermost ring is the per‑order stop – a hard price‑based ceiling that caps the loss on a single execution. The next ring is the daily strategy limit, which aggregates the P&L of all trades that belong to a particular systematic signal. Beyond that lies the account‑level limit, which monitors the net exposure of a trader’s capital across all strategies, and finally the firm‑level limit, which governs the aggregate risk of the whole desk. Each ring has three sub‑bands – warning, reduction and shutdown – that trigger progressively more severe actions. The system must also remember the state of each band across trading sessions; an automatic restart of the algorithm must not reset the budget that has already been consumed.
The problem is amplified by the nature of electronic markets. Orders sit in price‑time‑priority queues, and the value of an order is split between the spread that can be captured and the adverse‑selection cost that is incurred when the queue is displaced. The option value of retaining a place in line depends on the expected future spread and the probability of being filled before the market moves against the order. Consequently, an order’s lifetime cannot be judged solely by how long it has been in the book; the system must continuously reassess whether the expected spread, the adverse‑selection risk and the remaining budget in each hierarchy level still justify keeping the order alive.
How the mechanism works, step by step
When a new signal is generated, the algorithm first checks the per‑order stop. The stop is calculated in the instrument’s native currency and includes an estimate of transaction costs – exchange fees, clearing fees and any financing that will be incurred if the position is held overnight. If the projected loss, inclusive of those costs, exceeds the per‑order limit, the order is rejected outright.
If the order passes the first gate, the system proceeds to the daily strategy limit. Here the algorithm aggregates the unrealised P&L of all open positions that belong to the same strategy, adds any realised P&L from trades that have already been closed, and then adds the projected cost of the new order. The sum is compared against three thresholds. The warning band is set at 70 % of the daily risk appetite; crossing it generates an alert to the trader and may trigger a reduction in order size for the remainder of the day. The reduction band, at 90 % of the appetite, forces the algorithm to halve the notional of any further orders. The shutdown band, at 100 %, blocks any additional orders from that strategy until the next trading day.
Should the daily strategy limit be respected, the algorithm evaluates the account‑level limit. This limit aggregates across all strategies, converting unrealised and realised P&L into the account’s base currency using the prevailing FX rates. Financing charges for leveraged positions are added, and any overnight carry is also accounted for. The same three‑band structure applies, but the thresholds are higher, reflecting the larger capital base.
Finally, the firm‑level limit is consulted. It is the ultimate safety net, often expressed as a percentage of the firm’s total capital at risk. The firm limit is rarely reached in normal operation, but it is essential for protecting against systemic events where many strategies simultaneously generate losses. The hierarchy ensures that a breach at any inner level stops the order before it can contribute to an outer‑level breach.
A worked example with real numbers
Consider a statistical arbitrage strategy that trades a basket of European equity futures. The per‑order stop is set at €5 000 loss, inclusive of a €250 exchange fee and a €100 financing charge for a one‑day carry. The daily strategy risk appetite is €30 000, with warning at €21 000, reduction at €27 000 and shutdown at €30 000. The account base currency is USD, and the current EUR/USD rate is 1.10.
During the morning session ten independent signals fire, each proposing a trade that would lose €4 800 if the market moves against it. Individually each trade respects the per‑order stop (‑€4 800 < ‑€5 000). The algorithm therefore creates ten limit orders, each with a €250 fee and a €100 financing charge, so the total projected loss per trade is €5 150.
At the moment the first order is placed, the daily strategy P&L is flat, so the projected loss after the first trade would be €5 150, well below the warning band. The second order raises the projected cumulative loss to €10 300, still below the warning band. By the time the seventh order is queued, the cumulative projected loss reaches €36 050, which exceeds the shutdown band of €30 000. According to the hierarchy, the system must reject any further orders from this strategy for the day, even though each individual order still appears acceptable in isolation.
Because the account is denominated in USD, the system converts the cumulative projected loss to $39 655 ( €36 050 × 1.10). The account‑level limit for the day is $150 000, with a reduction band at $135 000. The strategy breach therefore occurs well before the account limit is touched, illustrating how a cluster of per‑order‑compliant trades can collectively violate the daily risk appetite.
If the algorithm were to restart automatically after a market pause, it must retain the fact that €36 050 of the daily budget has already been consumed. The restart logic therefore reads the persisted daily‑strategy‑used‑budget flag and continues to enforce the shutdown band, preventing a fresh set of ten trades from resetting the budget to zero.
Where it breaks in live markets
In live trading the hierarchy is most vulnerable when market conditions cause a large number of signals to be generated by the same factor – for example, a sudden shift in the term structure of interest rates that triggers a suite of curve‑steepening bets. The per‑order stops still look healthy because each trade is small relative to the stop size, but the aggregate exposure can swell rapidly.
Another common failure mode is the neglect of unrealised P&L in the calculation of the daily limit. Traders often focus on realised profit, assuming that unrealised losses will reverse. In a fast‑moving market, however, the unrealised loss can become realised in seconds, and if the system does not include it in the daily‑strategy calculation, the shutdown band is never reached until the loss has already materialised.
Currency conversion can also introduce a hidden breach. If the daily limit is set in the base currency but the trades are denominated in multiple foreign currencies, the conversion rate used at the time of order creation may differ from the rate at the time the loss is realised. A weakening of the base currency can inflate the loss in base‑currency terms, pushing the portfolio past the firm‑level limit without any explicit trigger.
Finally, the order‑lifetime reassessment described in the research can be ignored by naïve implementations that simply cancel an order after a fixed clock time. Because the value of a queue position depends on the expected spread and adverse‑selection risk, an order that has survived for ten seconds may become uneconomic after a sudden volatility spike, yet the system may continue to hold it, exposing the desk to a larger adverse‑selection cost than anticipated.
The operating path, stage by stage
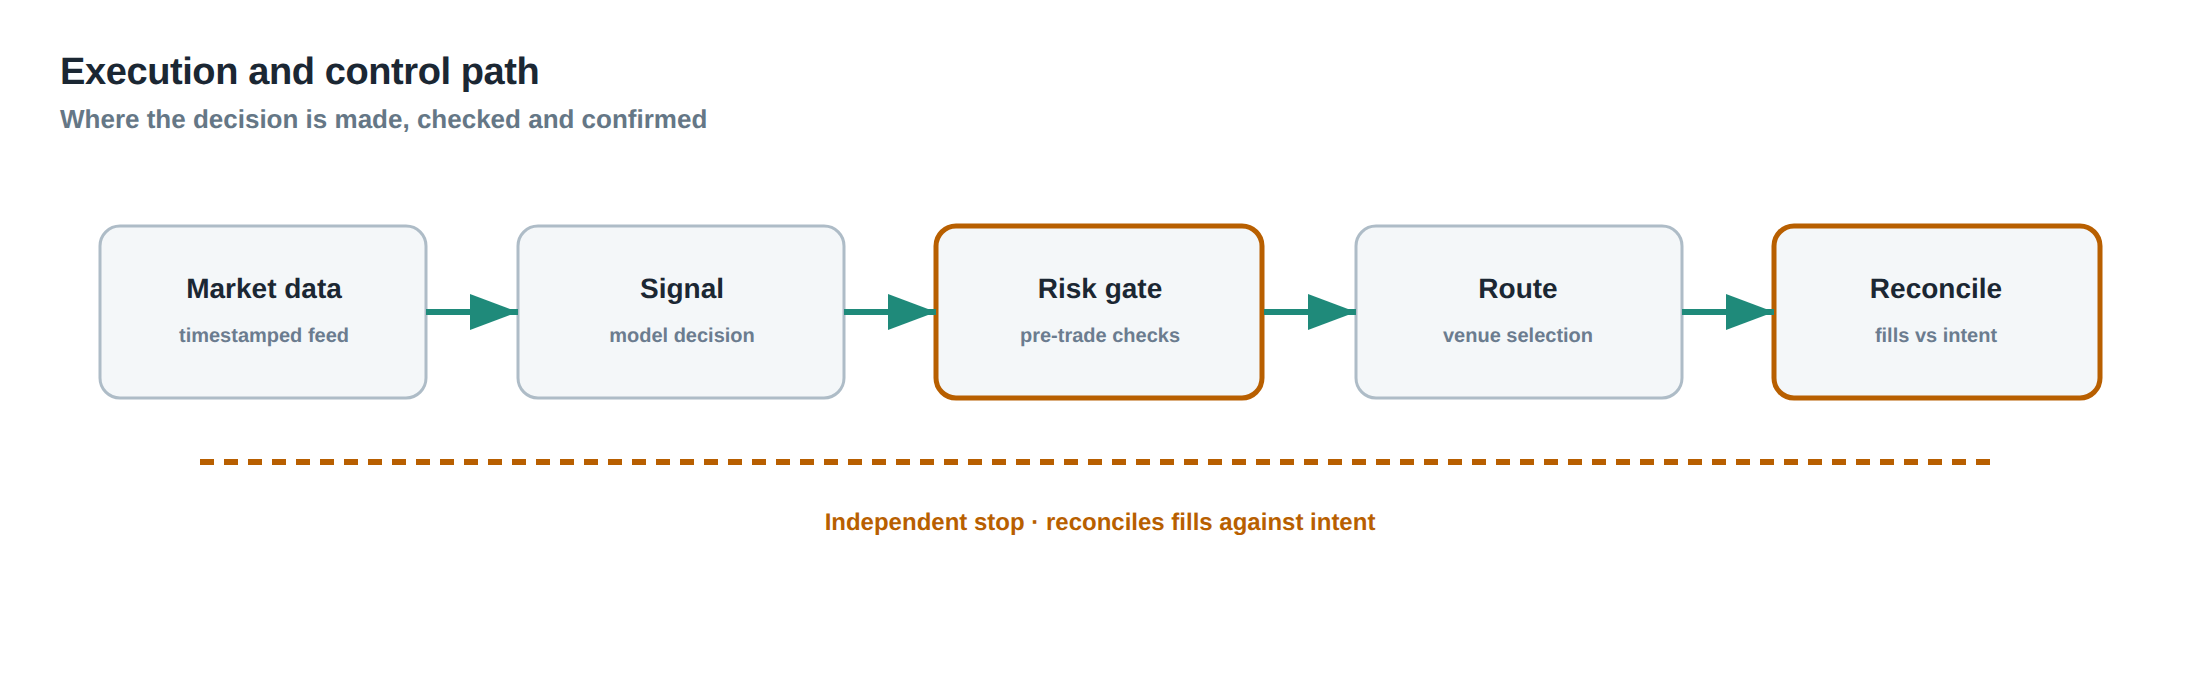
The first stage of the operating path is signal generation. The algorithm emits a vector of desired notional, instrument, side and a tentative stop level. At this point the per‑order risk engine validates the trade against the hard stop, adds fees, financing and any anticipated slippage, and either approves or rejects the order.
If approved, the trade moves to the strategy‑level aggregator. Here the engine pulls the current realised P&L, the unrealised mark‑to‑market of all open positions belonging to the same strategy, and the projected cost of the new order. The sum is compared to the three bands. Crossing the warning band raises an internal flag; crossing the reduction band automatically scales down the notional of the new order; crossing the shutdown band aborts the order and logs a breach event.
The third stage is the account‑level monitor. It receives the strategy‑level decision and adds the P&L of other strategies, converting all figures to the account’s base currency using the latest FX rates. The same three‑band logic applies, but the thresholds are larger. If the reduction band is hit, the engine may enforce a global notional cap for the remainder of the day.
The final stage is the firm‑level gatekeeper. It aggregates the account‑level exposures of all traders, applies any firm‑wide stress‑scenario adjustments, and checks against the firm‑level warning, reduction and shutdown bands. Only when all four layers approve does the order get sent to the execution gateway.
At each stage the system persists the amount of budget that has been consumed. The persistence layer is consulted on every restart, ensuring that a daily‑strategy shutdown band remains in force even after a market pause or a system reboot.
Controls that act before the damage
The hierarchy is reinforced by a set of pre‑emptive controls that act before a loss can accrue. The first control is the order‑lifetime reassessment. Every few milliseconds the execution engine evaluates the expected spread capture against the current adverse‑selection risk. If the expected net spread falls below a predefined threshold, the order is cancelled, regardless of how much time remains on its clock.
The second control is the dynamic fee and financing model. Rather than using static fee assumptions, the system updates the fee estimate based on current market liquidity and the prevailing financing rate for the instrument’s tenor. This ensures that the per‑order stop always reflects the true cost of holding the position.
The third control is the currency‑conversion hedge buffer. When a trade is denominated in a non‑base currency, the system adds a small buffer – typically 2 % of the projected loss – to the daily‑strategy calculation to absorb adverse FX moves that could otherwise push the portfolio over the firm limit.
The fourth control is the automatic budget‑freeze on breach. When a warning band is crossed, the system freezes the remaining budget for that level and forces all subsequent orders to request a manual override. The override must be justified in writing and approved by a risk manager, providing a human check before the reduction or shutdown band is reached.
These controls together create a multi‑dimensional safety net that operates before a trade can generate a loss large enough to threaten the higher‑level limits.
How to measure whether it is working
Measurement begins with the capture of two key metrics: breach frequency and budget utilisation efficiency. Breach frequency records how often each band – warning, reduction, shutdown – is triggered at each hierarchy level. A low frequency of shutdowns combined with a moderate frequency of warnings indicates that the limits are well‑calibrated.
Budget utilisation efficiency measures the proportion of the daily risk appetite that is actually used before the shutdown band is hit. If the utilisation consistently sits at 95 % or higher, the limits may be too tight, throttling profitable opportunities. Conversely, if utilisation rarely exceeds 50 %, the limits may be overly generous, leaving capital idle and exposing the desk to unexpected tail risk.
A third metric is the realised‑vs‑projected loss discrepancy. For each trade, the system logs the projected loss at the time of order entry and the realised loss at execution. The average absolute deviation should be small; large discrepancies suggest that the fee, financing or FX conversion models are inaccurate, or that the adverse‑selection risk is being underestimated.
Finally, the latency of the order‑lifetime reassessment is monitored. The time between a change in market conditions (e.g., a volatility spike) and the cancellation of orders whose expected spread has turned negative should be measured in milliseconds. Excessive latency indicates a bottleneck in the risk engine that could allow adverse‑selection losses to accumulate.
By tracking these metrics on a daily and weekly basis, the risk team can confirm that each rung of the hierarchy is functioning as intended and can adjust thresholds before a breach occurs.
The portfolio view
From the portfolio perspective the hierarchy translates into a disciplined allocation of risk capital. Each strategy receives a daily budget that is a fraction of the total account capital, and that budget is further subdivided into per‑order slices. The warning, reduction and shutdown bands act as colour‑coded signals that guide the trader’s behaviour: a yellow warning prompts a review of the signal quality, an orange reduction forces a scaling‑down of notional, and a red shutdown imposes a hard stop on further exposure.
Because the hierarchy respects both realised and unrealised P&L, the portfolio’s risk profile is continuously updated. A profitable trade that is still open contributes positively to the daily‑strategy limit, allowing the desk to take on additional positions within the same risk appetite. Conversely, a losing trade that is still unrealised erodes the remaining budget, tightening the constraints on new orders.
Currency exposure is managed through the conversion buffer described earlier, ensuring that the portfolio’s base‑currency risk does not unintentionally balloon. Financing costs are rolled into the per‑order stop, so that leveraged positions are not inadvertently subsidised by an under‑estimated carry charge.
When the hierarchy is respected, the portfolio behaves like a well‑engineered structure: the outermost firm limit protects the capital base, the account limit prevents a single trader from over‑leveraging, the strategy limit guards against correlation spikes, and the per‑order stop caps the damage from any single execution error. The result is a resilient trading operation that can withstand the inevitable clustering of market moves without breaching its risk appetite.
Do you have a clear, documented hierarchy of loss limits that survives system restarts and incorporates all sources of cost, or are you still relying on per‑order stops alone?
About the research behind this lesson
The seminar frames electronic markets as price-time-priority queues. It separates queue value into spread capture versus adverse-selection cost and the option value of retaining a place in line.
Applied to this lesson: An order lifetime therefore cannot be based on elapsed time alone: the system must reassess whether its queue position, expected spread and adverse-selection risk still justify keeping the order alive.
Two live systems, one desk
PULSE-X — power-packed HFT: high-frequency momentum on XAUUSD and EURUSD. System details · Live account
NIC-X — ultra-low drawdown: displaced-print arbitrage for large capital. System details · Live account
Start now: leave your email and request a free trial — we will send the pricing, the connection route and the trial terms. Pricing
Join the market discussion: Telegram @squawklive
Source: High-Frequency Trading and Modern Market Microstructure
Educational content only. Trading leveraged products involves risk.
Chat with XTRSK
Chat ready
Start a chat and the XTRSK team will be notified immediately.