
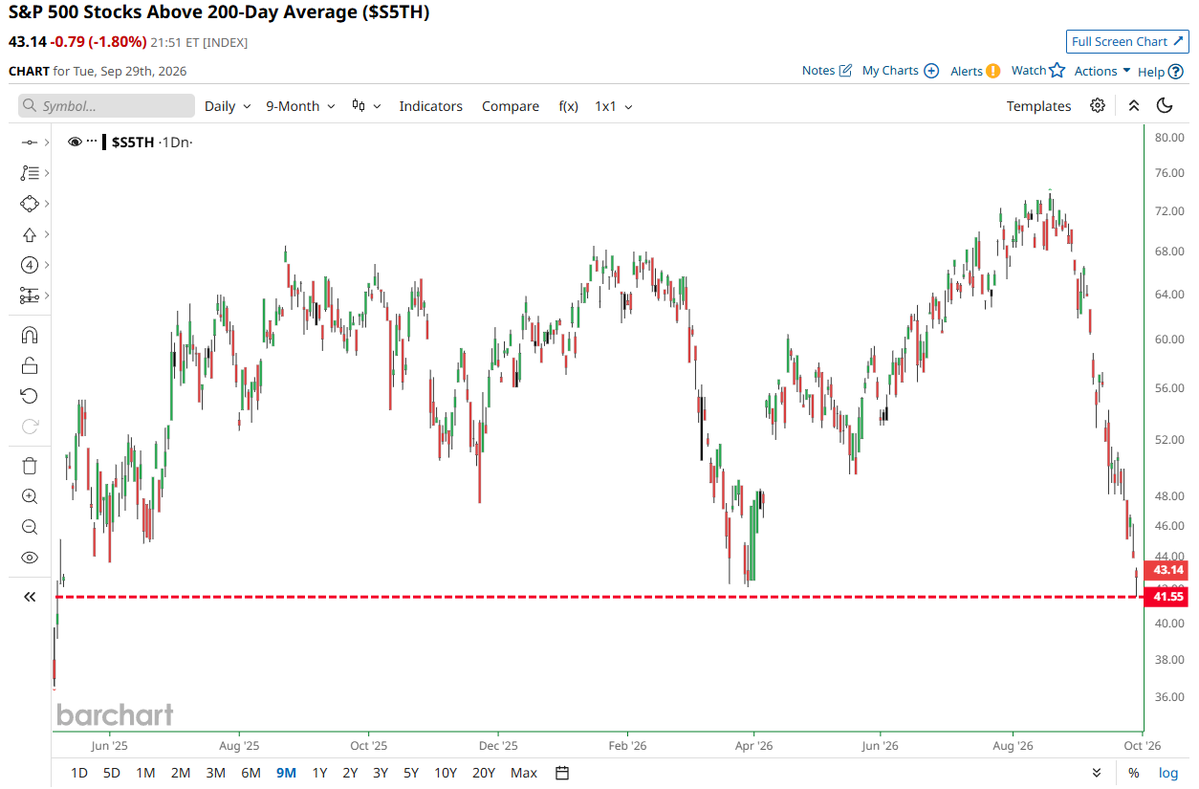
When the Majority of S&P 500 Falls Below Its 200‑Day MA: Signals and Strategies
Research preview
A record‑high proportion of S&P 500 constituents are now trading under their 200‑day moving average, a classic sign of weakening market breadth. This article explains why the 200‑day MA matters, how to interpret extreme breadth readings, and what quantitative tools can turn the signal into actionable risk management. Why the 200‑Day Moving Average Matters The 200‑day moving average (MA) is a simple filter that smooths two years of daily price data into a single trend line. When a stock price stays above the 200‑day MA, the long‑term trend is typically considered bullish; crossing below suggests a shift to bearish momentum....
Client research
Register free or login to read the full report
Registration is free. The full report includes chart snapshots, level work, technical tables, catalyst context, and the complete desk read.
Chat with XTRSK
Chat ready
Start a chat and the XTRSK team will be notified immediately.