
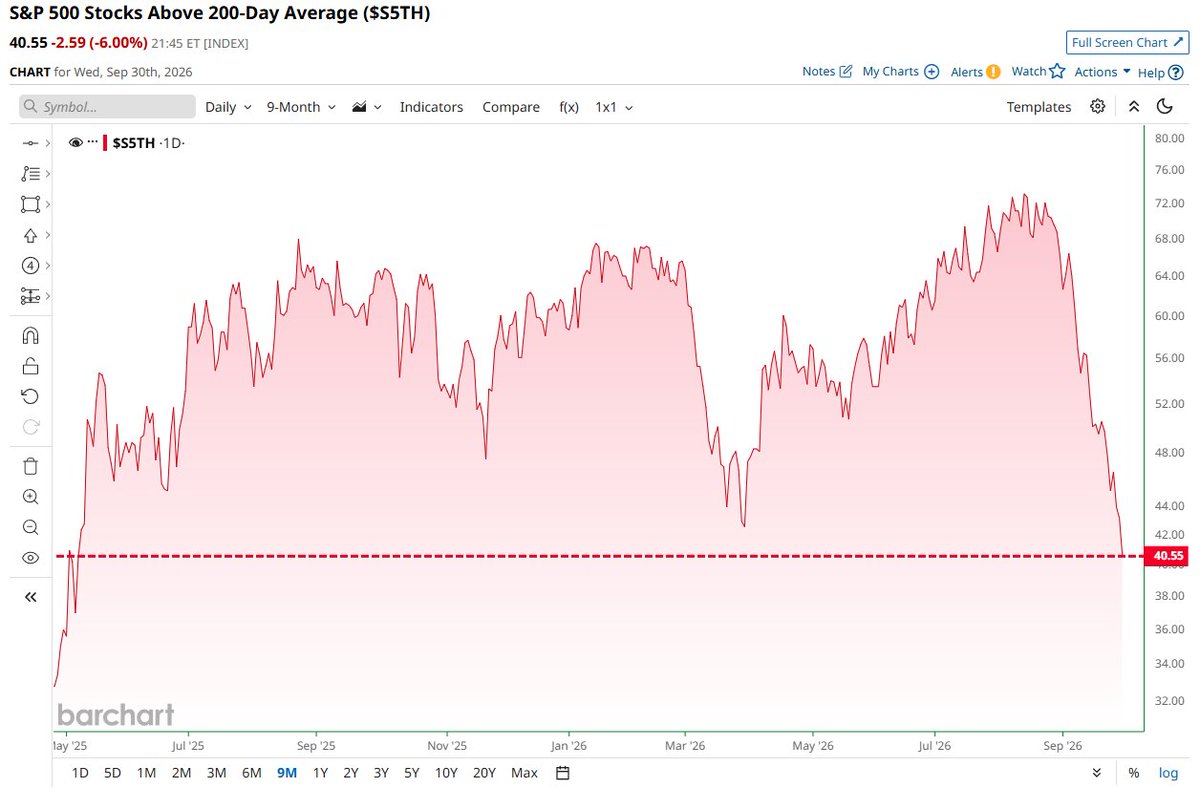
Market Breadth Warning: Nearly 60% of S&P 500 Below 200‑Day MA – Implications for Quant Strategies
Research preview
The S&P 500 is showing its weakest breadth since mid‑2025, with almost six‑tenths of its constituents trading below the 200‑day moving average. For quantitative traders this signal raises questions about trend‑following models, risk premia, and the reliability of traditional factor exposures. The following analysis connects the breadth indicator to core concepts from investment theory and offers practical steps for adapting portfolios. Why Breadth Matters in a Quantitative Framework Breadth measures the proportion of stocks participating in a market move. When a majority of constituents are below a long‑term trend line, the market’s upward momentum is fragile....
Client research
Register free or login to read the full report
Registration is free. The full report includes chart snapshots, level work, technical tables, catalyst context, and the complete desk read.
Chat with XTRSK
Chat ready
Start a chat and the XTRSK team will be notified immediately.