XCore HFT / Trading Lab
PULSE: A kill switch is a system, not a button
Quantitative execution, market-microstructure, and risk-control research from XTRSK.
What this problem really is
Electronic market participants are accustomed to thinking of a “kill switch” as a single button that, when pressed, halts all activity. In practice the problem is far more complex. A trading strategy runs on a stack of processes – order entry, risk checks, market data handling, hedging, and post‑trade reconciliation – each of which may hold open positions or pending orders at a variety of venues. If the emergency control only terminates the primary process, the residual orders and unmatched hedge legs continue to generate exposure. The result is a partial shutdown that can amplify loss rather than contain it.
The underlying difficulty stems from the way modern markets allocate price‑time priority. An order that has secured a place in the queue enjoys a potential spread capture, but it also bears adverse‑selection risk that can change in milliseconds. The value of the queue position is therefore an option: the trader holds the right to trade at the quoted price while the market moves. When a failure occurs, the system must decide whether to preserve that option, to cancel the order, or to flatten the associated position. Each choice has a distinct impact on the residual risk profile.
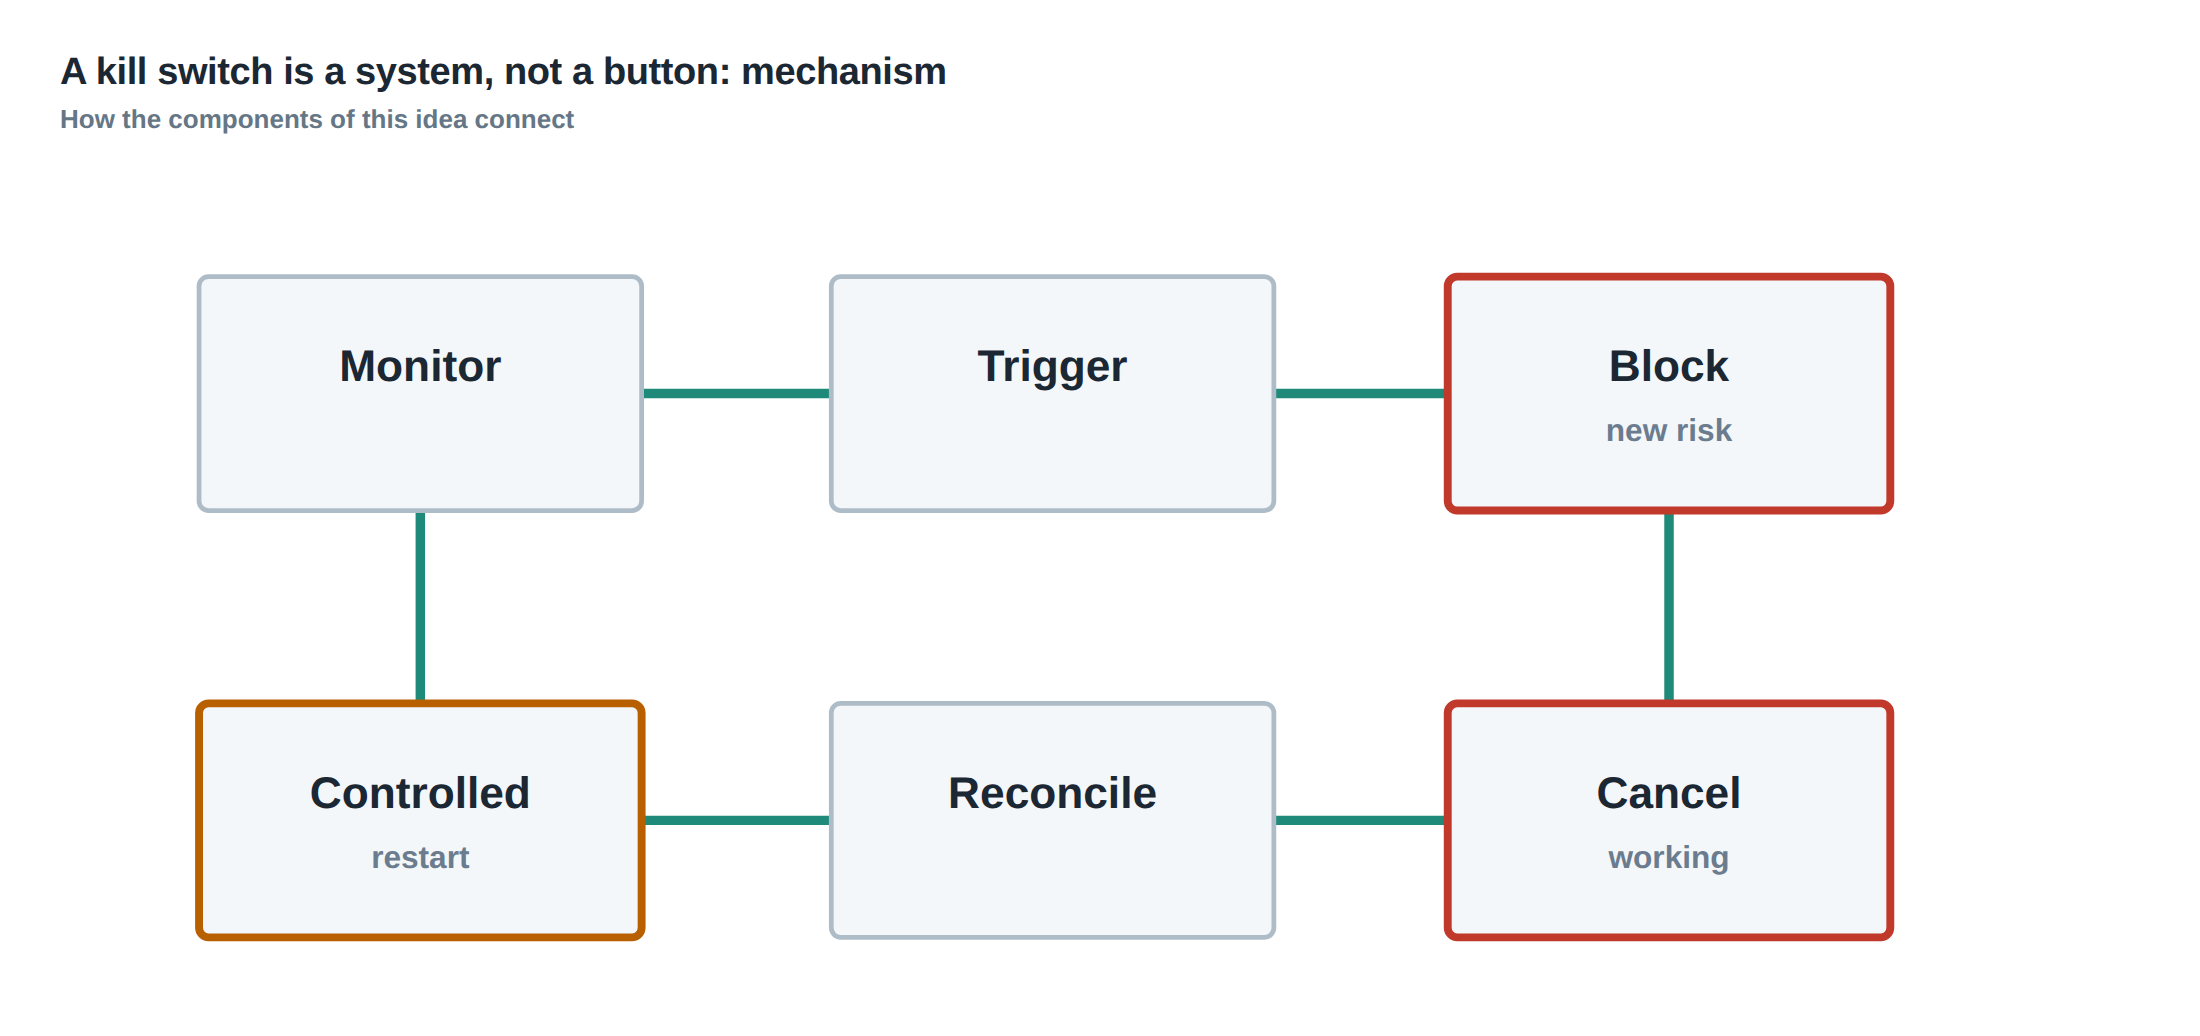
A robust emergency control must therefore be a system, not a button. It must be able to identify every live order, every open hedge leg, and every risk metric that could be affected by a shutdown. Only then can it execute a coordinated sequence that stops new risk, removes or neutralises existing risk, and finally reports the remaining exposure to the risk team.
How the mechanism works, step by step
The first step is to classify the scope of the stop. A strategy‑level stop applies only to the set of orders and positions generated by a single algorithm. An account‑level stop expands the scope to all strategies running under a particular capital allocation, while a firm‑wide stop overrides every active process across the organisation. The classification determines the breadth of the subsequent actions.
Second, the system queries the order book for each venue where the strategy has a presence. It extracts the order identifiers, the remaining quantity, the price level, and the time‑in‑force. Simultaneously it checks the hedge book for any legs that were opened to offset the primary exposure. The query must be performed outside the failing application – for example through a dedicated risk‑engine API that remains operational even if the trading stack crashes.
Third, the control decides on the appropriate action for each item: cancel, flatten, or both. Cancel means sending a cancellation request to the venue and awaiting acknowledgement; flatten means sending a marketable order that closes the position immediately, which may be necessary if the venue does not support cancellation of a resting order. In many cases a hybrid approach is required – cancel the limit order and, if it is already partially filled, flatten the residual position.
Fourth, the system records the acknowledgement of each request, timestamps it, and updates an internal exposure register. If any acknowledgement fails, the control escalates to a manual override path that allows a risk manager to intervene directly with the venue’s support desk.
Finally, the control produces a concise exposure report that lists: (i) orders successfully cancelled, (ii) positions flattened, (iii) any orders that remain active, and (iv) the net market‑value exposure after the emergency actions. The report is broadcast to the risk dashboard, compliance, and senior management, ensuring that the remaining risk is visible instantly.
A worked example with real numbers
Consider a statistical arbitrage strategy that trades the EUR/USD spot market and simultaneously hedges its delta exposure in the E‑mini S&P 500 futures market. At 09:45 GMT the strategy has three live limit orders on the EUR/USD venue:
– Order A: 1 million EUR at 1.0805, 10 % of the intended notional, time‑in‑force GTC. – Order B: 500 k EUR at 1.0798, 5 % of the intended notional, time‑in‑force GTC. – Order C: 250 k EUR at 1.0812, 2.5 % of the intended notional, time‑in‑force IOC (still pending).
The hedge leg consists of a short position of 2 contracts in the E‑mini, each representing a notional of $50 k, opened at 4 500 points to offset the EUR/USD exposure.
At 09:46 GMT a critical data‑feed failure causes the order‑entry engine to hang. The emergency system is triggered at the strategy level. First it sends cancellation requests for Orders A and B. The venue acknowledges the cancellation of Order A after 120 ms, but Order B is partially filled – 200 k EUR have already executed at 1.0799 before the cancellation request arrived. The system therefore issues a flattening market order for the remaining 300 k EUR of Order B, which is filled at 1.0800 within 80 ms.
Order C, being an IOC, is automatically removed by the venue when the order‑entry engine stops sending heartbeat messages, so no explicit cancellation is required.
The hedge leg, however, remains open. The control recognises the residual short exposure of 2 contracts and, because the market is volatile, decides to flatten the hedge immediately. A market order to buy 2 contracts is sent and is filled at 4 510 points, incurring a realised P&L of +$20 k on the hedge.
The final exposure report shows:
– Cancelled: Order A (1 m EUR). – Flattened: 300 k EUR from Order B, Order C (0 EUR), hedge leg (2 contracts). – Remaining open: none.
The net market‑value exposure after the emergency actions is a residual profit of $12 k from the EUR/USD side, offset by the $20 k hedge gain, leaving a modest net loss of $8 k – a far better outcome than the uncontrolled continuation of the original positions, which could have escalated to a multi‑million‑dollar loss in a few seconds.
Where it breaks in live markets
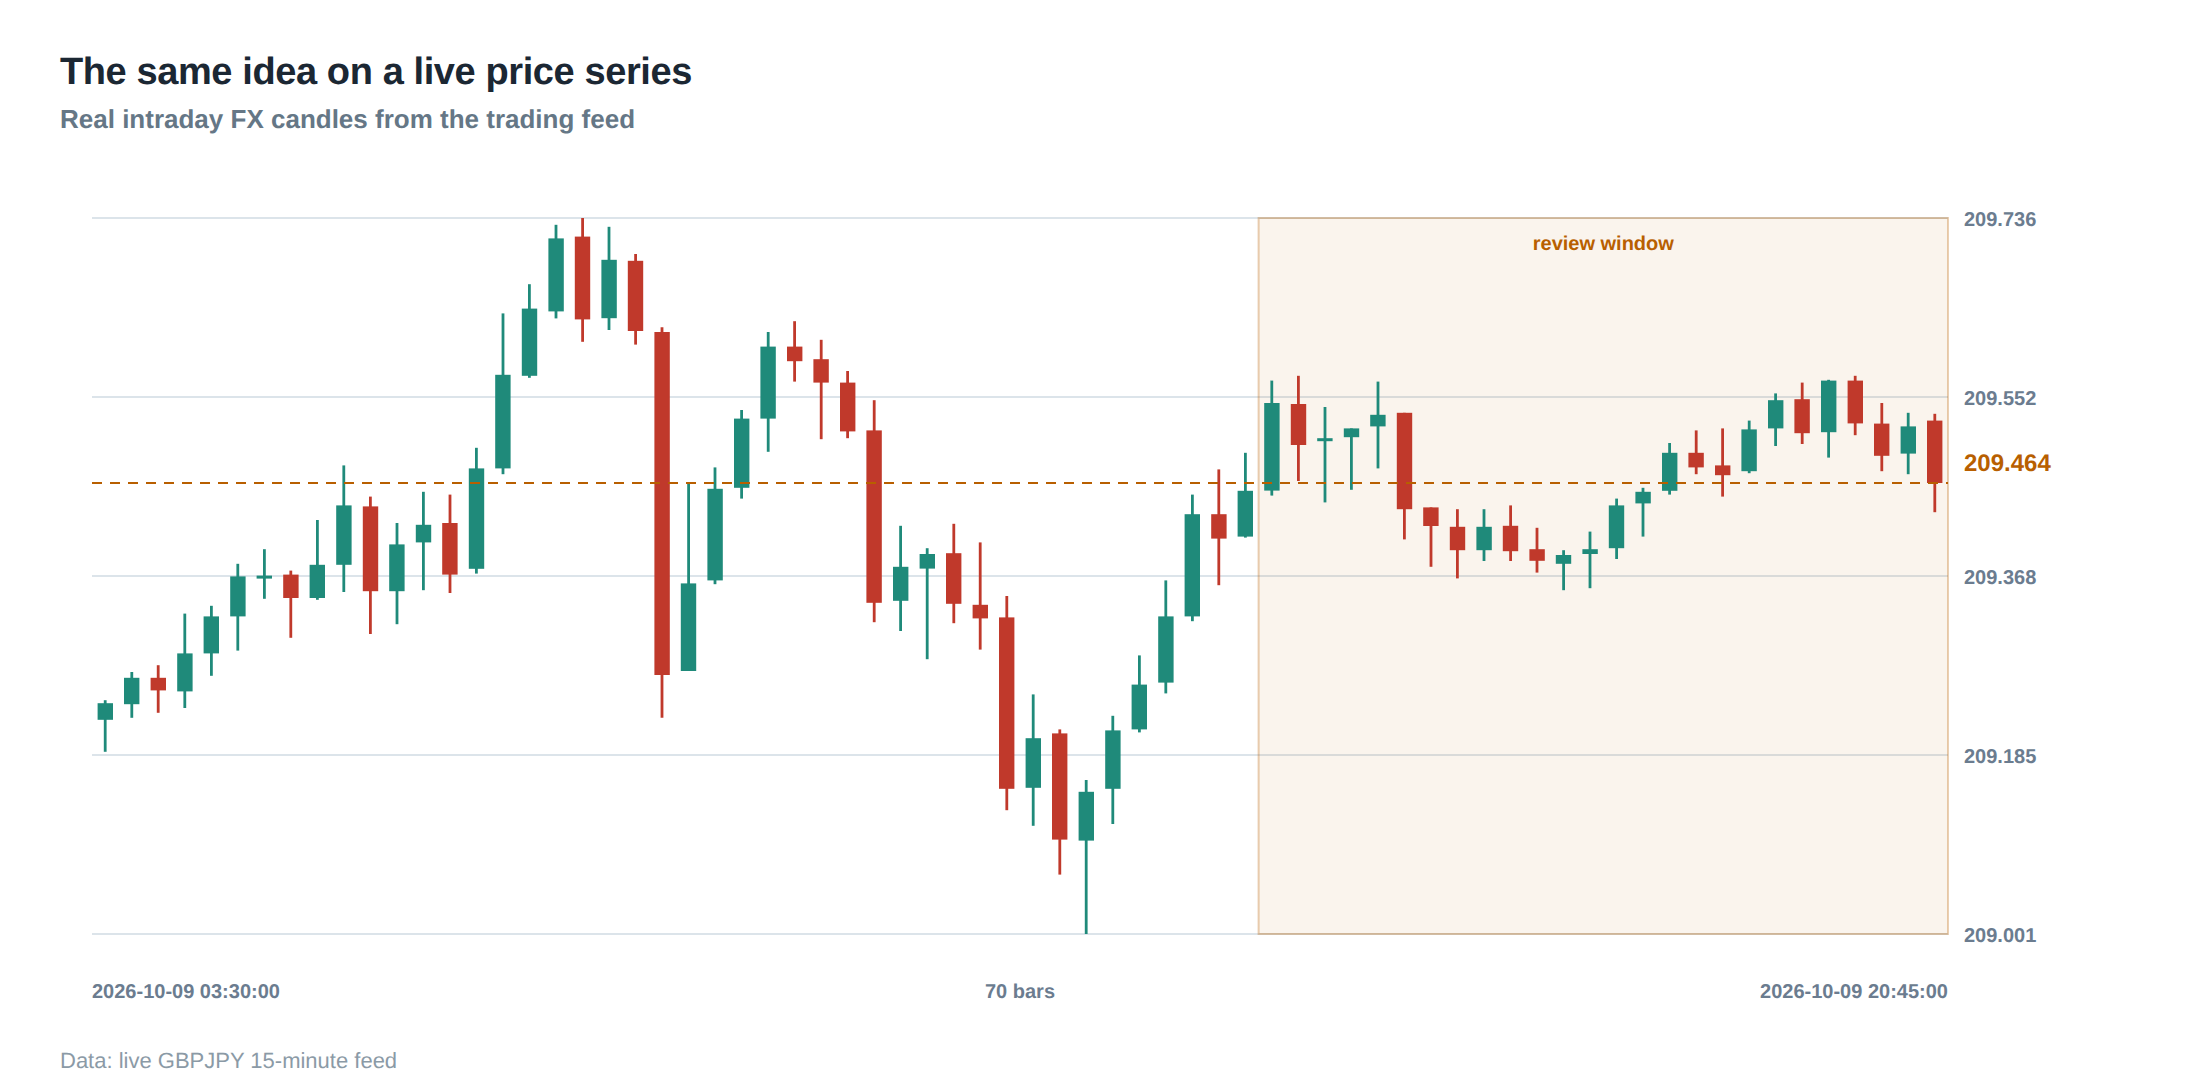
In a live environment the most common failure points are the communication channels between the trading engine and the venues. Latency spikes, packet loss, or outright disconnections can leave orders in an indeterminate state – the venue may have accepted the order, but the trader’s acknowledgement never arrives. When the emergency control attempts to cancel such an order, the venue may respond with “order not found”, leading the system to assume the order is already gone while it still sits in the queue.
Another fragile area is the hedging subsystem. Hedging often runs on a separate process that receives risk signals via a message bus. If the bus stalls, the hedge may never be flattened, leaving a directional exposure that the primary kill switch does not see. Because the hedge may be on a different asset class, the risk metrics used to decide whether to flatten (e.g., VaR, stress‑scenario loss) may be mis‑aligned with the primary strategy’s parameters, causing the control to apply an inappropriate action.
A third source of breakdown is human‑in‑the‑loop escalation. When an acknowledgement fails, the system must hand over to a risk manager. If the escalation path is not pre‑authorised, the manager may lack the permissions to send a flattening order, or may be unavailable due to time‑zone differences. The result is a dead‑end where the emergency control cannot complete its sequence, and the residual orders continue to accrue risk.
Finally, the reporting layer can become a bottleneck. If the exposure register is stored in a database that is also affected by the failure, the final report may be delayed or incomplete, leaving senior management unaware of the remaining exposure. In fast‑moving markets, even a delay of a few seconds can translate into a material change in the portfolio’s risk profile.
The operating path, stage by stage
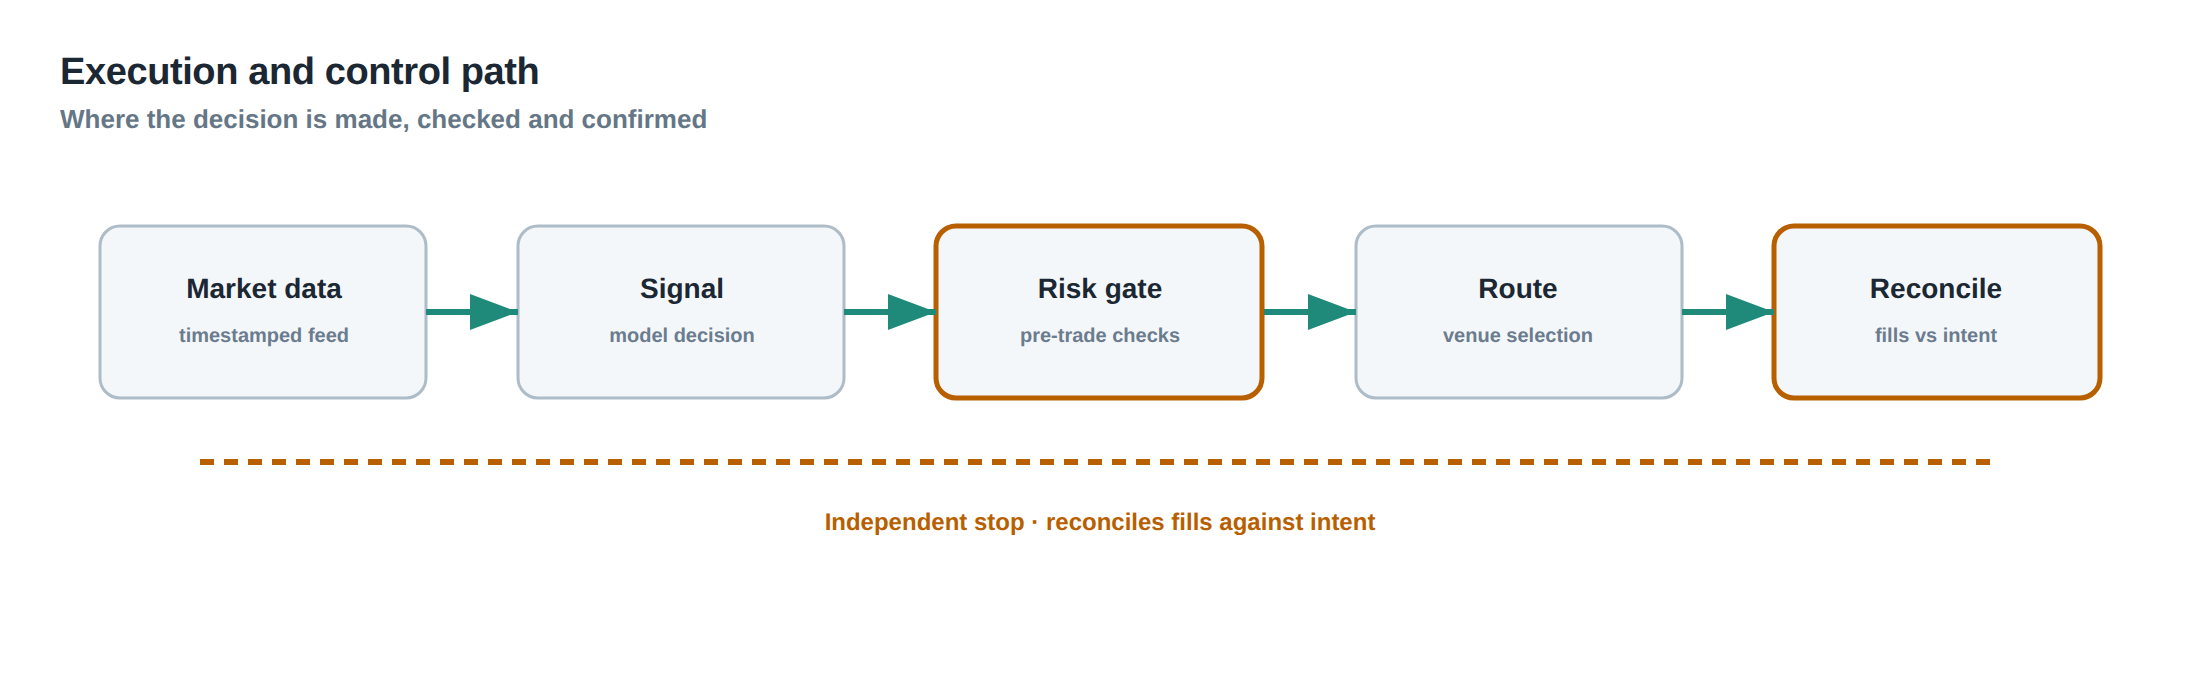
The emergency control follows a deterministic pipeline that can be visualised as a flow chart. The first node is the trigger detection – either an automated health‑check that flags a process crash, or a manual activation by a risk operator. The second node branches according to the scope: strategy, account, or firm. Each branch then invokes a “order inventory” sub‑process that queries every venue for live orders linked to the scope.
The third node evaluates each order against a decision matrix: if the order is a limit order with remaining quantity, the default action is cancel; if the order is partially filled, the action becomes flatten the residual; if the order is a market order already executed, it is ignored. The decision matrix also incorporates market‑state inputs – for example, if the venue is currently in a circuit‑breaker state, the control may prefer flattening to avoid cancellation rejections.
The fourth node dispatches the appropriate messages – cancellation or marketable flatten – to the venues via a resilient messaging layer that retries on transient failures. Each dispatch is tagged with a unique correlation identifier.
The fifth node collects acknowledgements, updates the exposure register, and flags any failures. Unacknowledged items are escalated to a manual override queue, where a senior risk manager can authorise a direct API call or a phone order.
The final node compiles the exposure report, timestamps it, and publishes it simultaneously to the risk dashboard, the compliance log, and the incident‑management system. The report also contains a “recovery ready” flag that indicates whether all actions have completed successfully and whether normal trading can resume.
Controls that act before the damage
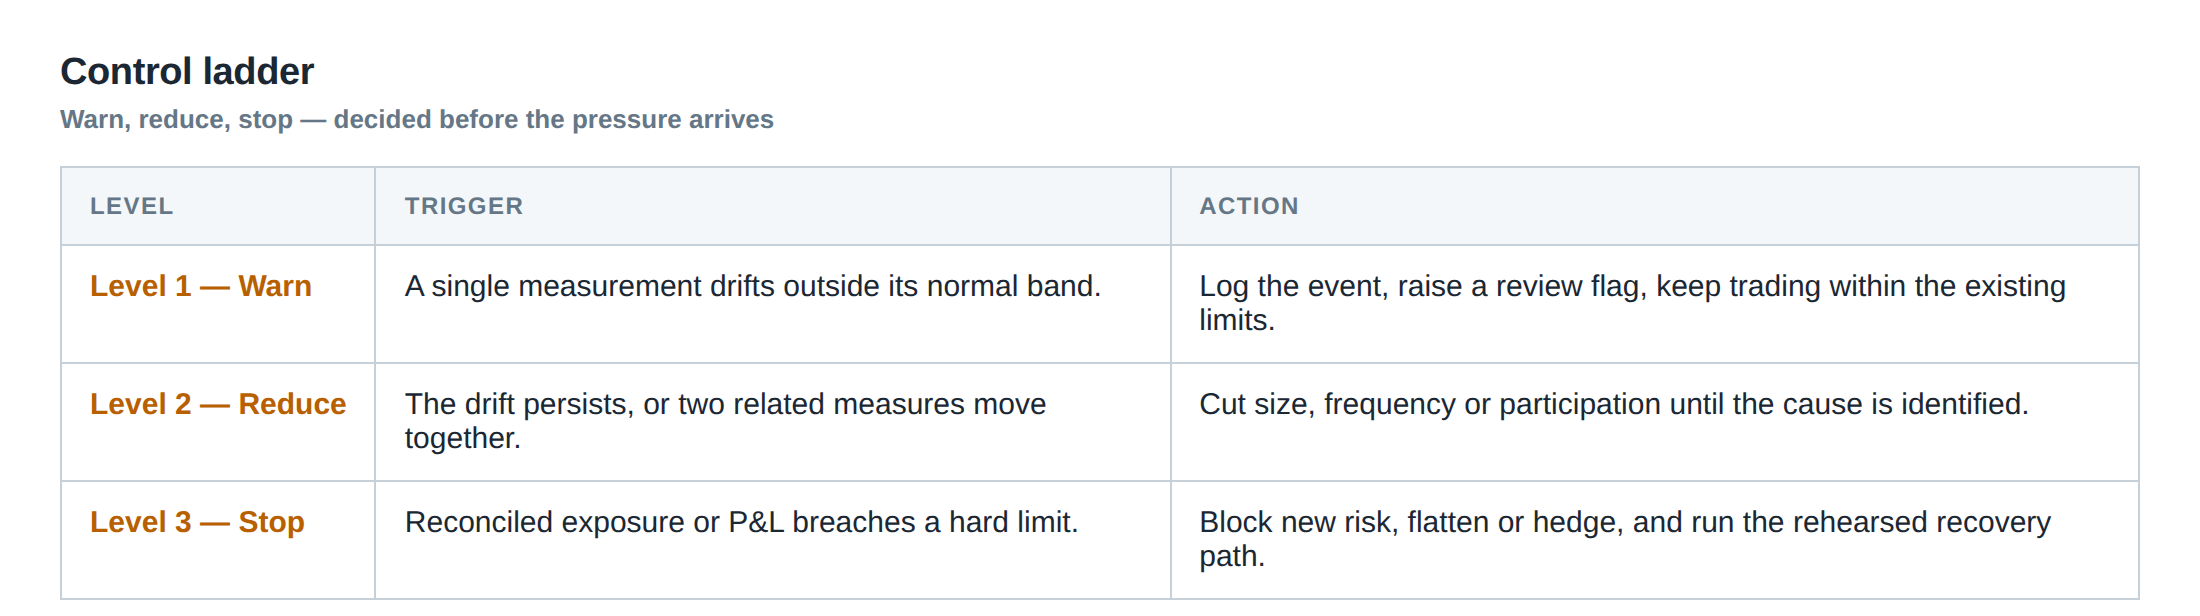
Pre‑emptive controls are the first line of defence. They begin with a ladder of permission levels: a low‑risk strategy may have an automatic strategy‑stop that fires on any health‑check failure, whereas a high‑leverage account may require dual‑operator acknowledgement before an account‑stop can be enacted. The ladder also defines the depth of the action – a “soft stop” merely blocks new order submission, while a “hard stop” proceeds to cancel and flatten as described earlier.
The system must expose these controls through a separate, hardened interface that does not rely on the primary trading stack. A dedicated risk‑engine service, running on an isolated server, hosts the emergency API. This service maintains a read‑only view of the order book via a market‑data feed that is duplicated from the production feed, ensuring that even if the main feed collapses the emergency service still knows which orders are live.
Testing these controls is a continuous process. Permissions are validated by simulating a stop request from each role – trader, risk analyst, compliance officer – and confirming that the system accepts or rejects the request according to the ladder. Acknowledgement paths are exercised by injecting artificial latency and packet loss, verifying that the system retries and eventually records a successful cancellation or flatten. Recovery drills are run weekly: the team initiates a forced crash of a strategy, observes the automatic stop, and then manually restores the process, confirming that the exposure register returns to a clean state.
These drills must be documented, with metrics on time‑to‑stop, time‑to‑acknowledge, and time‑to‑recover. The data feed into a post‑mortem analysis that feeds back into the design of the emergency control, tightening thresholds where necessary.
How to measure whether it is working
Measurement begins with latency statistics. The interval between trigger detection and the first cancellation request should be logged for every incident; a target of under 200 ms is typical for high‑frequency desks. The second metric is acknowledgement success rate – the proportion of cancellation or flatten messages that receive a positive response within a predefined window (e.g., 500 ms).
A third indicator is residual exposure after the control completes. Using the exposure register, the system calculates the net market‑value of all open positions and compares it to a pre‑stop baseline. The ratio of residual to baseline exposure should be below a tight threshold – often 1 % for low‑leverage strategies and 5 % for high‑leverage accounts.
Fourth, the frequency of manual escalations is a health signal. An increase in escalations suggests that the automated path is failing more often, perhaps due to venue‑specific changes or network degradation. The number of escalations per month should be tracked and investigated when it exceeds a moving‑average threshold.
Finally, drill performance provides a leading indicator. If the average time to complete a simulated stop drifts upward over successive drills, the team must review the underlying cause – whether it is a code regression, a change in venue API latency, or a resource contention on the risk‑engine server. By aggregating these metrics into a dashboard, senior management can see at a glance whether the kill‑switch system remains fit for purpose.
The portfolio view
From a portfolio perspective the emergency control is not an isolated gadget but a component of the broader risk architecture. The portfolio manager monitors aggregate VaR, stress‑scenario losses, and liquidity metrics. When a strategy stop fires, the portfolio’s risk engine must instantly re‑price the remaining exposure, taking into account that some orders have been removed and some positions have been flattened.
The option‑valued nature of queue positions, as highlighted by recent research, means that the portfolio’s expected spread capture can change dramatically when a stop is triggered. If the system simply cancels an order without considering the adverse‑selection cost that the order was already bearing, the portfolio may over‑estimate the benefit of the cancellation. Consequently the risk engine should adjust the expected spread component by modelling the loss of queue position as a negative option payoff.
Conversely, flattening a position removes the adverse‑selection exposure but may incur market impact, especially in illiquid venues. The portfolio view must therefore incorporate an impact model that estimates the cost of flattening, adding it to the post‑stop P&L projection.
When the emergency control finishes, the portfolio dashboard should display a concise “post‑stop snapshot”: total notional, net exposure, realised P&L from the stop actions, and an updated VaR figure. This snapshot enables the portfolio manager to decide whether to re‑allocate capital, to restart the strategy after a cooldown period, or to retire the algorithm altogether.
The overarching lesson is that a kill switch must be built as a layered, testable system that integrates tightly with order management, risk, and compliance. Only by treating it as a full‑stack process can a prop‑trading desk guarantee that an emergency truly stops new risk, removes existing risk, and leaves a transparent picture of what remains.
Will your current emergency controls survive the next unexpected market shock, or are they merely a button waiting to fail?
About the research behind this lesson
The seminar frames electronic markets as price-time-priority queues. It separates queue value into spread capture versus adverse-selection cost and the option value of retaining a place in line.
Applied to this lesson: An order lifetime therefore cannot be based on elapsed time alone: the system must reassess whether its queue position, expected spread and adverse-selection risk still justify keeping the order alive.
Explore PULSE: System details
PULSE live account: Verify the live account on FX Blue
Live chat and updates: Telegram @xtrskhft
Source: High-Frequency Trading and Modern Market Microstructure
Educational content only. Trading leveraged products involves risk.
Chat with XTRSK
Chat ready
Start a chat and the XTRSK team will be notified immediately.