XCore HFT / Trading Lab
PULSE: Lot size translates a stop into money
Quantitative execution, market-microstructure, and risk-control research from XTRSK.
What this problem really is
When a trader quotes a stop loss, the price distance from the entry to that stop is often mistaken for the amount of capital that will be lost if the stop is hit. In reality the loss in monetary terms is the product of three independent quantities: the size of the position, the contract specifications of the instrument, and the currency conversion that translates a price move into account currency. If any of those three components is ignored, the trader’s risk budget – the amount of capital they are willing to sacrifice on a single trade – becomes a vague intention rather than a hard limit.
The distinction matters because the same price distance can represent a negligible loss on a tiny position and a catastrophic loss on a large one. Conversely, a wide stop does not automatically increase risk; it merely offers the opportunity to scale the position down while keeping the monetary exposure constant. The core thesis of this article is that distance alone is a geometric concept, while risk is an arithmetic one that only materialises after the position is sized and the instrument’s value per tick is applied.
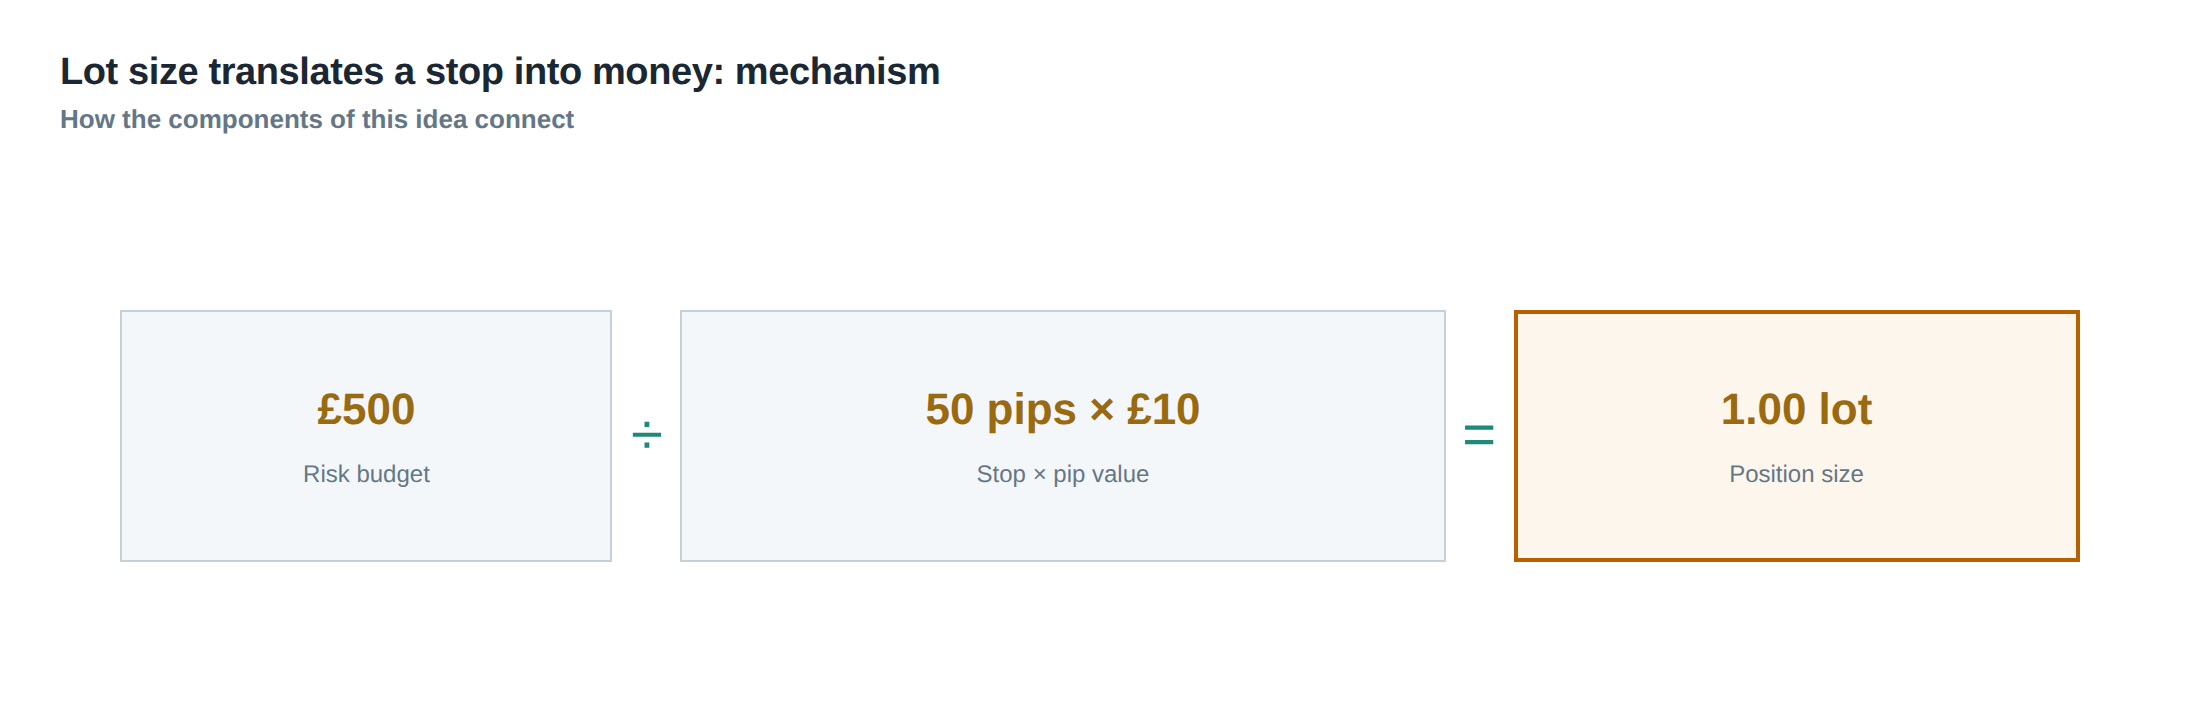
A disciplined prop‑trading desk therefore starts every trade idea with an explicit risk budget – for example £500 – and works backwards. The stop distance is measured in price units, then converted through contract size, tick value and any required currency conversion. The resulting figure is rounded down to the minimum lot increment allowed by the venue, and finally adjusted for spread and expected slippage. Only after those steps is the trade entered, and only then does the stop become a real monetary guardrail.
The research underpinning this approach stresses that risk cannot be summarised by a single realised outcome. Instead, it must be built from the full distribution of possible returns, including the tails where extreme losses live. In fast‑moving strategies the median latency or average fill quality is insufficient; the trader must also understand the probability of delayed fills, stale orders and the shape of the loss distribution when the execution chain behaves abnormally. Those considerations feed directly into the sizing calculations that translate a stop into a concrete £ amount.
How the mechanism works, step by step
The first step is to define the absolute monetary amount that the desk is prepared to lose on the trade. This risk budget is expressed in the account currency and is usually a fixed percentage of the overall capital, for example 0.5 % of a £100 000 fund, yielding a £500 risk limit.
Next the trader measures the stop distance in price terms. For a futures contract that might be 20 ticks, for a CFD it could be 0.0150 in price, and for an FX spot it could be 50 pips. The raw distance is then multiplied by the contract’s tick value – the amount of money that each minimum price movement represents – to obtain the loss per contract. If the contract is quoted in a foreign currency, a conversion factor is applied to bring the figure into the account currency.
The resulting per‑contract loss is divided into the risk budget, and the integer part of the quotient is taken as the maximum number of contracts that can be taken without exceeding the budget. Because most venues enforce a minimum lot size and a lot increment (for example 0.01 lot for a CFD or one contract for a futures), the trader rounds the calculated position down to the nearest permissible increment.
A final adjustment accounts for the cost of entering and exiting the trade. The spread – the difference between the best ask and best bid at the moment of execution – is an immediate loss that must be deducted from the risk budget before sizing. Expected slippage, the additional adverse price movement that occurs between order submission and fill, is also subtracted. The adjusted budget is then re‑applied to the per‑contract loss to confirm that the rounded position still respects the original risk tolerance.
If any of the inputs change – for example the stop is widened due to increased volatility, or the underlying instrument’s tick value is altered after a contract roll – the entire calculation is repeated. The desk thereby maintains a dynamic link between market conditions and the monetary protection afforded by the stop.
A worked example with real numbers
Assume a prop desk has allocated a £500 risk budget for a single trade on a European index future that trades in euros. The contract specification is 10 € per index point, with a minimum price movement (tick) of 0.5 points, giving a tick value of 5 € per tick. The current EUR/GBP exchange rate is 0.85, so each euro is worth £0.85.
The trader decides on a stop that is 20 ticks away from the entry price. The raw price distance is therefore 20 ticks × 0.5 points = 10 index points. Converting to monetary terms per contract: 10 points × 10 € = 100 €, which in GBP is 100 € × 0.85 = £85. This £85 represents the loss that would be incurred if a single contract were stopped out, ignoring execution costs.
Dividing the £500 risk budget by the £85 per‑contract loss yields 5.88 contracts. The venue’s lot increment for this future is one full contract, so the trader rounds down to five contracts. Five contracts would lose £425 if the stop is hit, leaving £75 of the risk budget unused for other contingencies.
Now incorporate spread and slippage. The current bid‑ask spread on the future is 0.2 points, equivalent to 0.2 points × 10 € = 2 € or £1.70. Expected slippage, based on recent order‑book dynamics, is estimated at an additional 0.3 points (3 € or £2.55). The total immediate cost per contract is therefore £4.25. For five contracts the upfront cost is £21.25, which must be subtracted from the £500 budget, leaving £478.75 for the stop loss itself.
Re‑calculating the permissible contracts with the reduced budget: £478.75 ÷ £85 ≈ 5.63, still rounded down to five contracts. The trade therefore proceeds with five contracts, a stop 20 ticks away, and an anticipated total loss of £425 plus £21.25 in execution costs, totalling £446.25 – comfortably within the original £500 risk limit.
If market volatility rises and the trader widens the stop to 40 ticks, the raw loss per contract doubles to £170. The same £500 budget now supports only 2.94 contracts, rounded down to two. After accounting for spread and slippage (still £4.25 per contract), the total exposure becomes £340 + £8.50 = £348.50, again respecting the risk budget. This illustrates the core thesis: a wider stop does not automatically increase monetary risk; it merely reduces the allowable position size, keeping the absolute risk constant.
Where it breaks in live markets
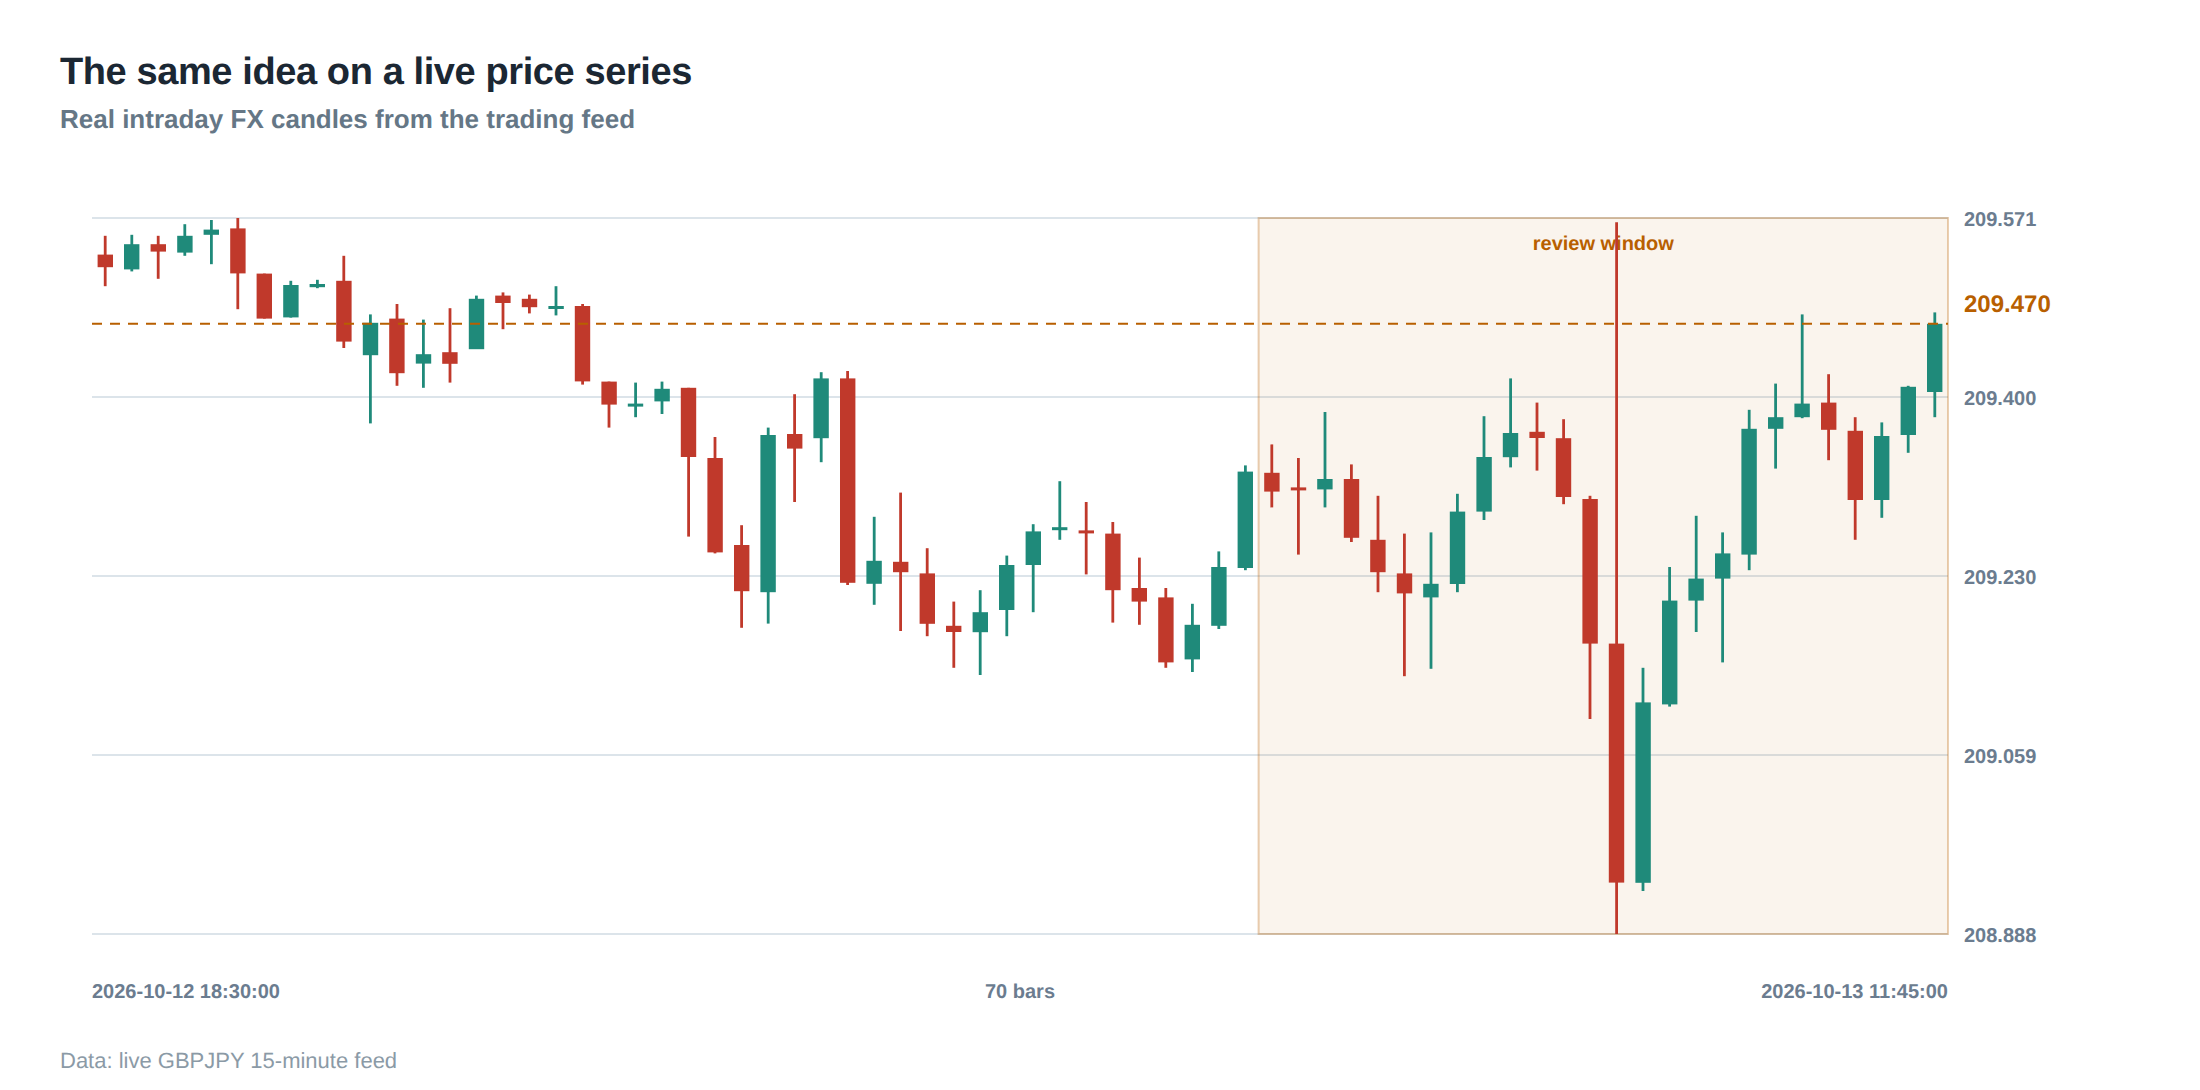
The neat arithmetic described above assumes that the stop will be triggered at the quoted price, that the contract specifications remain static, and that execution costs are predictable. In reality, several frictions can cause the calculated monetary risk to be breached.
First, market gaps can cause the price to jump over the stop level, especially in low‑liquidity venues or during macro‑economic announcements. When the gap exceeds the stop distance, the actual loss per contract can be many times larger than the theoretical £85 in the example.
Second, the venue may impose a minimum order size larger than the rounded‑down figure, forcing the trader to take a larger position than the risk budget permits. Some markets also have variable lot increments that tighten during volatile periods, making the rounding step less favourable.
Third, the spread can widen dramatically in stressed conditions, and slippage can become non‑linear as order‑book depth evaporates. If the trader’s slippage model is based on recent calm‑market data, the actual cost may be several times higher, eroding the buffer that was left after the initial sizing.
Finally, currency conversion risk is often overlooked. If the account is denominated in GBP but the contract settles in EUR, a sudden move in EUR/GBP can amplify the loss per contract beyond the originally calculated £85. In extreme cases, the conversion factor can change enough to invalidate the entire sizing decision made minutes earlier.
These breakdowns highlight why the stop‑to‑money translation must be revisited continuously, and why risk controls need to anticipate tail events rather than rely solely on average‑case assumptions.
The operating path, stage by stage
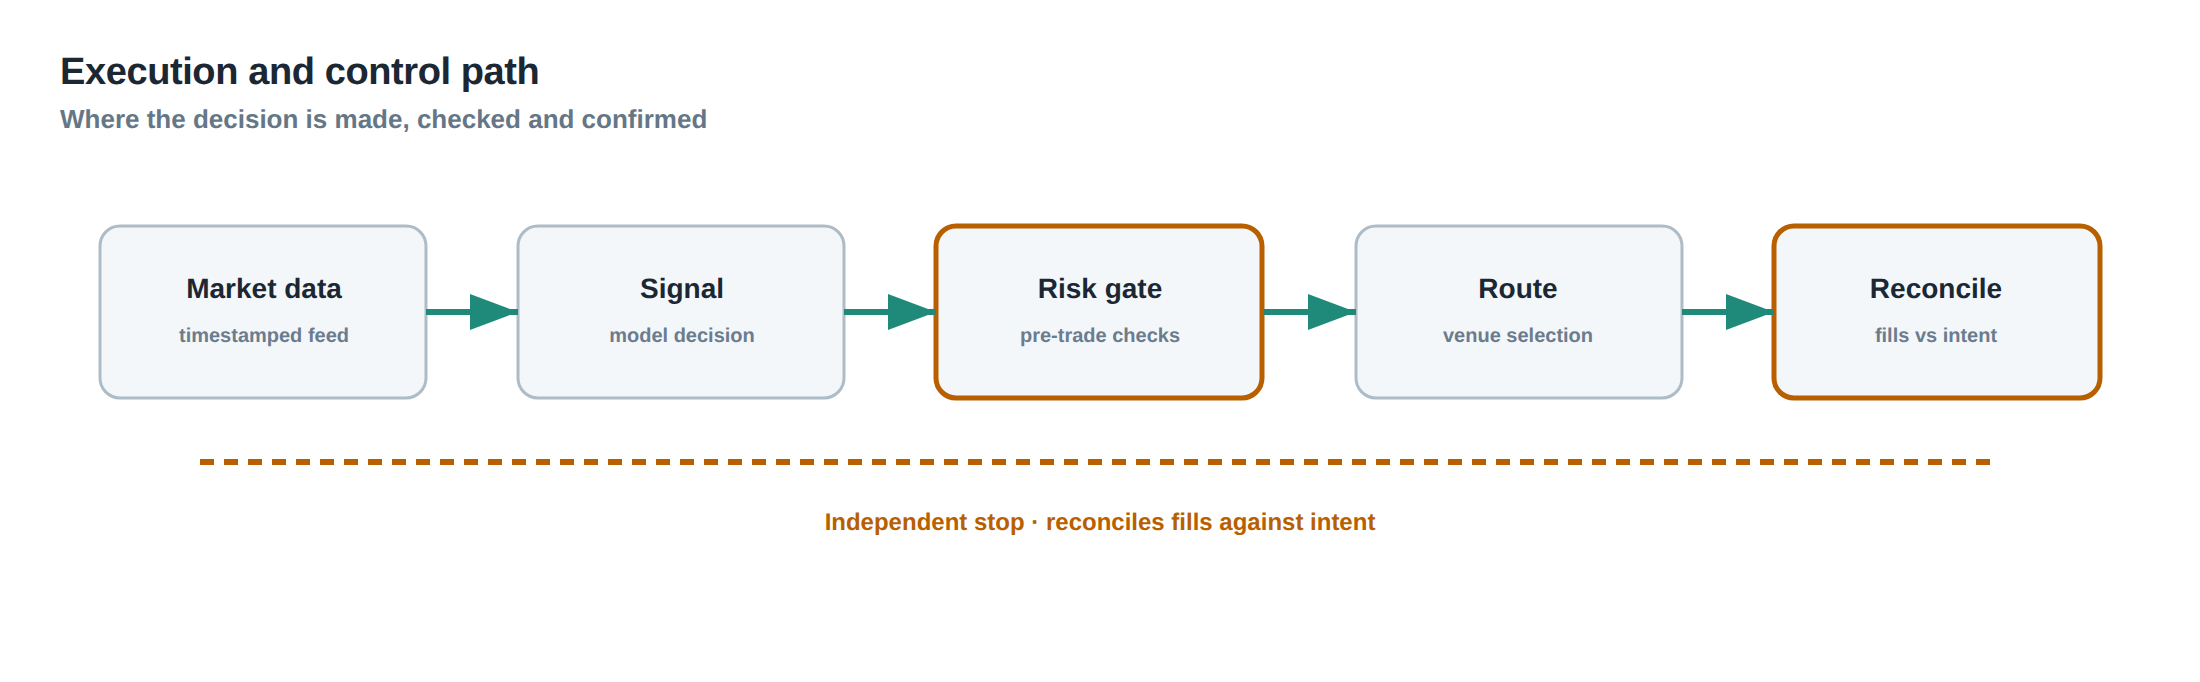
The desk’s workflow begins with the generation of a trade idea, after which the risk manager assigns a specific monetary risk budget. The next stage is the quantitative sizing engine, which ingests the stop distance, contract specifications, current tick value and FX rates, and outputs a raw position size.
A compliance filter then checks the raw size against venue‑specific lot increments and minimum order sizes, rounding down as required. The filtered size is passed to the execution module, which adds the latest spread and slippage estimates to the risk budget, recomputes the permissible size, and finally produces the order ticket.
Once the order is live, a monitoring daemon watches the market for any deviation in spread, volatility or FX rate that would invalidate the original sizing. If a threshold is crossed – for example a spread widening beyond a pre‑set multiple of its recent average – the daemon triggers an automatic position reduction or a protective hedge.
At the point of stop execution, the post‑trade reconciliation system records the actual fill price, the realised spread, and any slippage. It then calculates the true monetary loss and compares it to the original risk budget, flagging any breach for review. The final stage is a risk‑performance audit that aggregates the trade’s outcome with the desk’s overall risk metrics, feeding the insights back into the next round of idea generation.
This linear yet feedback‑rich path ensures that the abstract notion of “stop distance” is continually anchored to concrete monetary exposure throughout the trade lifecycle.
Controls that act before the damage
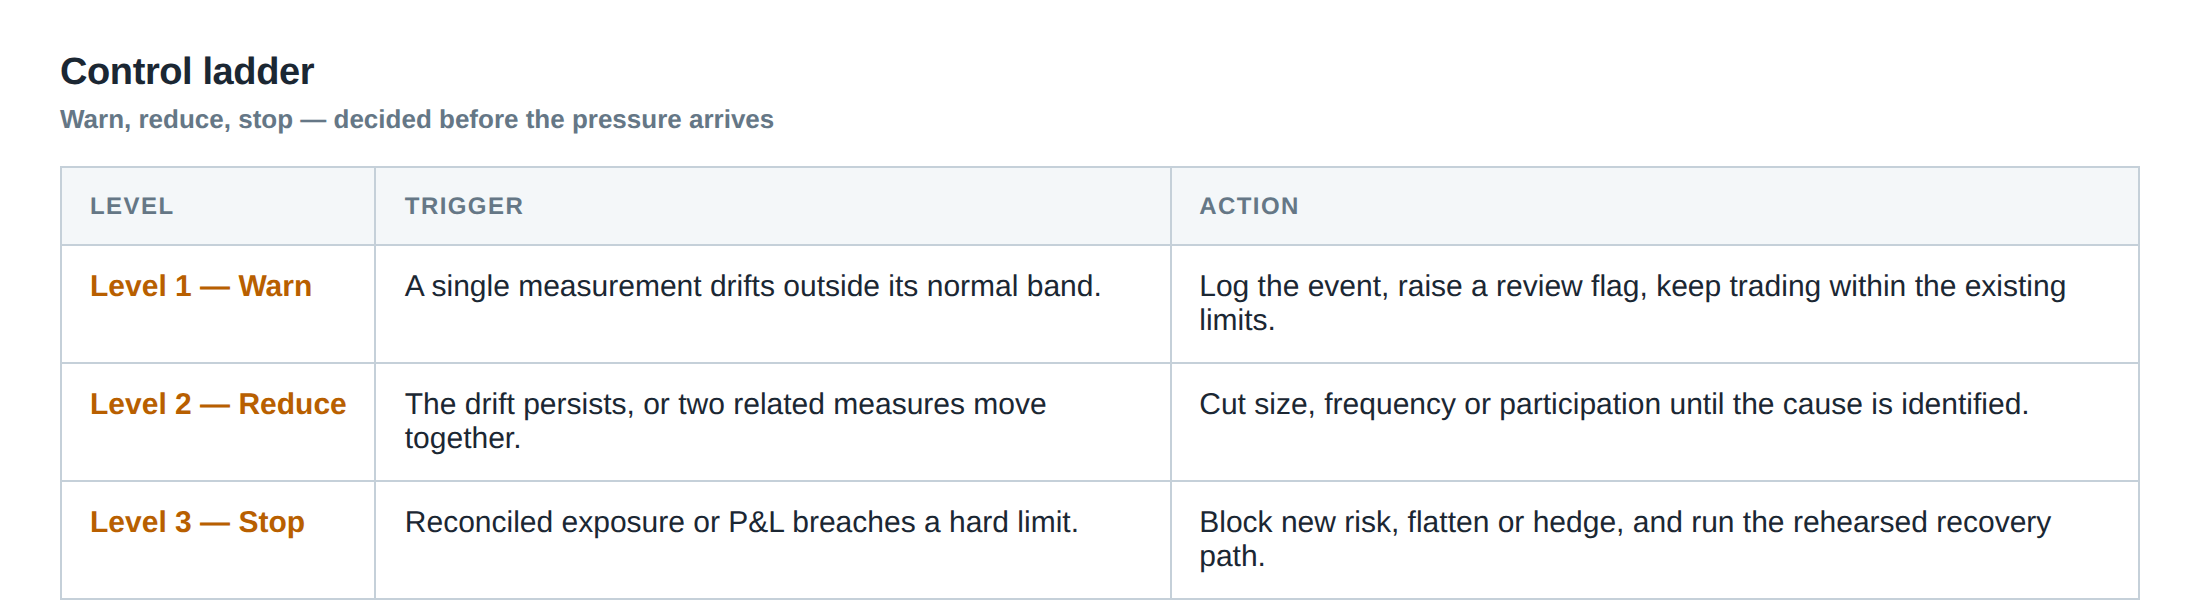
Preventative controls are layered to stop a trade from ever exceeding its risk budget. The first line of defence is the hard limit embedded in the order‑management system: it rejects any order whose calculated exposure exceeds the pre‑allocated £500, regardless of user intent.
A second control is the dynamic spread filter, which monitors the live market and refuses to send orders when the spread widens beyond a configurable multiple of its historical median. This guards against the scenario where the assumed £1.70 spread in the example suddenly inflates to £5, which would have eaten a larger portion of the risk budget.
Third, a volatility‑adjusted stop‑width rule forces the trader to widen the stop only when a volatility indicator, such as the average true range over the past 20 periods, exceeds a certain threshold. The rule automatically reduces the position size in proportion to the widening stop, preserving the monetary risk.
Finally, an FX‑hedge buffer is maintained for all foreign‑denominated contracts. The desk holds a small position in the relevant currency pair that offsets sudden adverse moves in the conversion rate, ensuring that the £85 per‑contract loss remains stable even if EUR/GBP spikes.
Each control operates before the trade leaves the desk’s internal systems, thereby limiting the chance that an unexpected market event can translate into a breach of the risk budget.
How to measure whether it is working
Effectiveness is assessed by comparing the realised loss distribution against the theoretical limits set by the sizing engine. The primary metric is the proportion of stopped‑out trades whose total monetary loss – including spread, slippage and currency conversion – exceeds the original risk budget. A well‑tuned system should keep this proportion below a pre‑agreed threshold, for example 0.5 % of all trades.
A secondary metric tracks the frequency of stop‑gap events, where the market price jumps past the stop level. By logging the price at which the stop order is generated and the price at which the fill occurs, the desk can compute the average gap size and its tail probability. A rising tail probability signals that the stop distance may be too tight relative to prevailing liquidity.
The third measurement looks at the utilisation of the risk budget. If the average realised loss per trade is consistently far below the allocated £500, the desk may be under‑leveraging and leaving capital idle. Conversely, frequent near‑budget breaches indicate that the spread and slippage models are under‑estimating execution costs.
These quantitative checks are supplemented by periodic stress‑testing, where historical high‑volatility periods are replayed with the current sizing parameters to verify that the system would have respected the risk budget under extreme conditions. The results feed back into the parameters of the spread filter, volatility rule and FX‑hedge buffer.
By continuously monitoring these indicators, the desk can confirm that the abstract conversion of stop distance into money remains robust across market regimes.
The portfolio view
When each trade is evaluated in isolation, the focus is on the single‑trade risk budget. In a portfolio context, the aggregation of those individual risks determines the overall capital at risk. The desk therefore imposes a second‑order limit on the sum of the monetary risk exposures across all open positions, often expressed as a percentage of the total capital.
Correlation between instruments is a key factor. Two positions with stops that are far apart in price space may still be exposed to the same market shock, for example a sudden equity market sell‑off that moves both an index future and a related CFD in the same direction. The portfolio risk model therefore adjusts the individual risk budgets to reflect the covariance matrix of the underlying assets.
Dynamic rebalancing is required when the portfolio’s risk profile drifts. If a series of winning trades leaves the desk with a high concentration of risk in a single sector, the risk manager may lower the per‑trade budget for new ideas in that sector, or tighten the stop‑width rule to force smaller positions. Conversely, after a series of losses that reduce the overall capital, the absolute £500 risk budget may be scaled down proportionally to preserve the intended risk‑percentage of the fund.
Finally, the portfolio view incorporates the tail‑risk measures highlighted in the research summary. Rather than relying on median latency or average fill quality, the desk examines the distribution of execution delays and loss magnitudes across all trades. The tail of that distribution informs the setting of the spread filter, the size of the FX‑hedge buffer, and the aggressiveness of the volatility‑adjusted stop rule. In this way, the translation of a stop into money is not a static calculation but a living component of the desk’s holistic risk architecture.
Do you currently verify that every stop you set translates to a concrete monetary loss before you commit capital?
About the research behind this lesson
Andrew Lo's lectures build risk analysis from return distributions and statistical measures, rather than treating one realised result as a complete description of risk.
Applied to this lesson: For a fast strategy, median latency or average fill quality is not enough. The review has to include tail delays, stale-order frequency and the loss distribution when cancellation or routing behaves abnormally.
Explore PULSE: System details
PULSE live account: Verify the live account on FX Blue
Live chat and updates: Telegram @xtrskhft
Source: Risk and Return
Educational content only. Trading leveraged products involves risk.
Chat with XTRSK
Chat ready
Start a chat and the XTRSK team will be notified immediately.