XCore HFT / Trading Lab
Capacity is where size consumes edge
Quantitative execution, market-microstructure, and risk-control research from XTRSK.
What this problem really is
When a strategy is first back‑tested it is usually assumed that the market will absorb any order size without moving the price. In reality every trade displaces the limit‑order book, and the displacement grows non‑linearly with the quantity placed. The moment a trader begins to push the market through its own liquidity the “edge” that was measured on a one‑lot scale can evaporate. The problem is therefore not a lack of alpha, but a loss of alpha caused by the trader’s own impact.
The phenomenon is most visible in markets that operate on a price‑time‑priority queue. An order that sits at the best bid or offer enjoys a theoretical spread capture, but each additional share added to the queue deepens the order’s exposure to adverse selection and to the cost of moving the mid‑price. When the order’s lifetime is measured only in seconds the trader may overlook the fact that the expected spread and the probability of being front‑run are changing continuously as the queue evolves.
In practice the capacity of a strategy is the point at which the expected net profit per trade, after accounting for all impact‑related costs, reaches zero. The capacity curve is therefore a function of participation rate, volatility, and the shape of the order‑book. Once the curve is crossed the strategy becomes a net‑loss generator, even if the underlying signal remains unchanged.
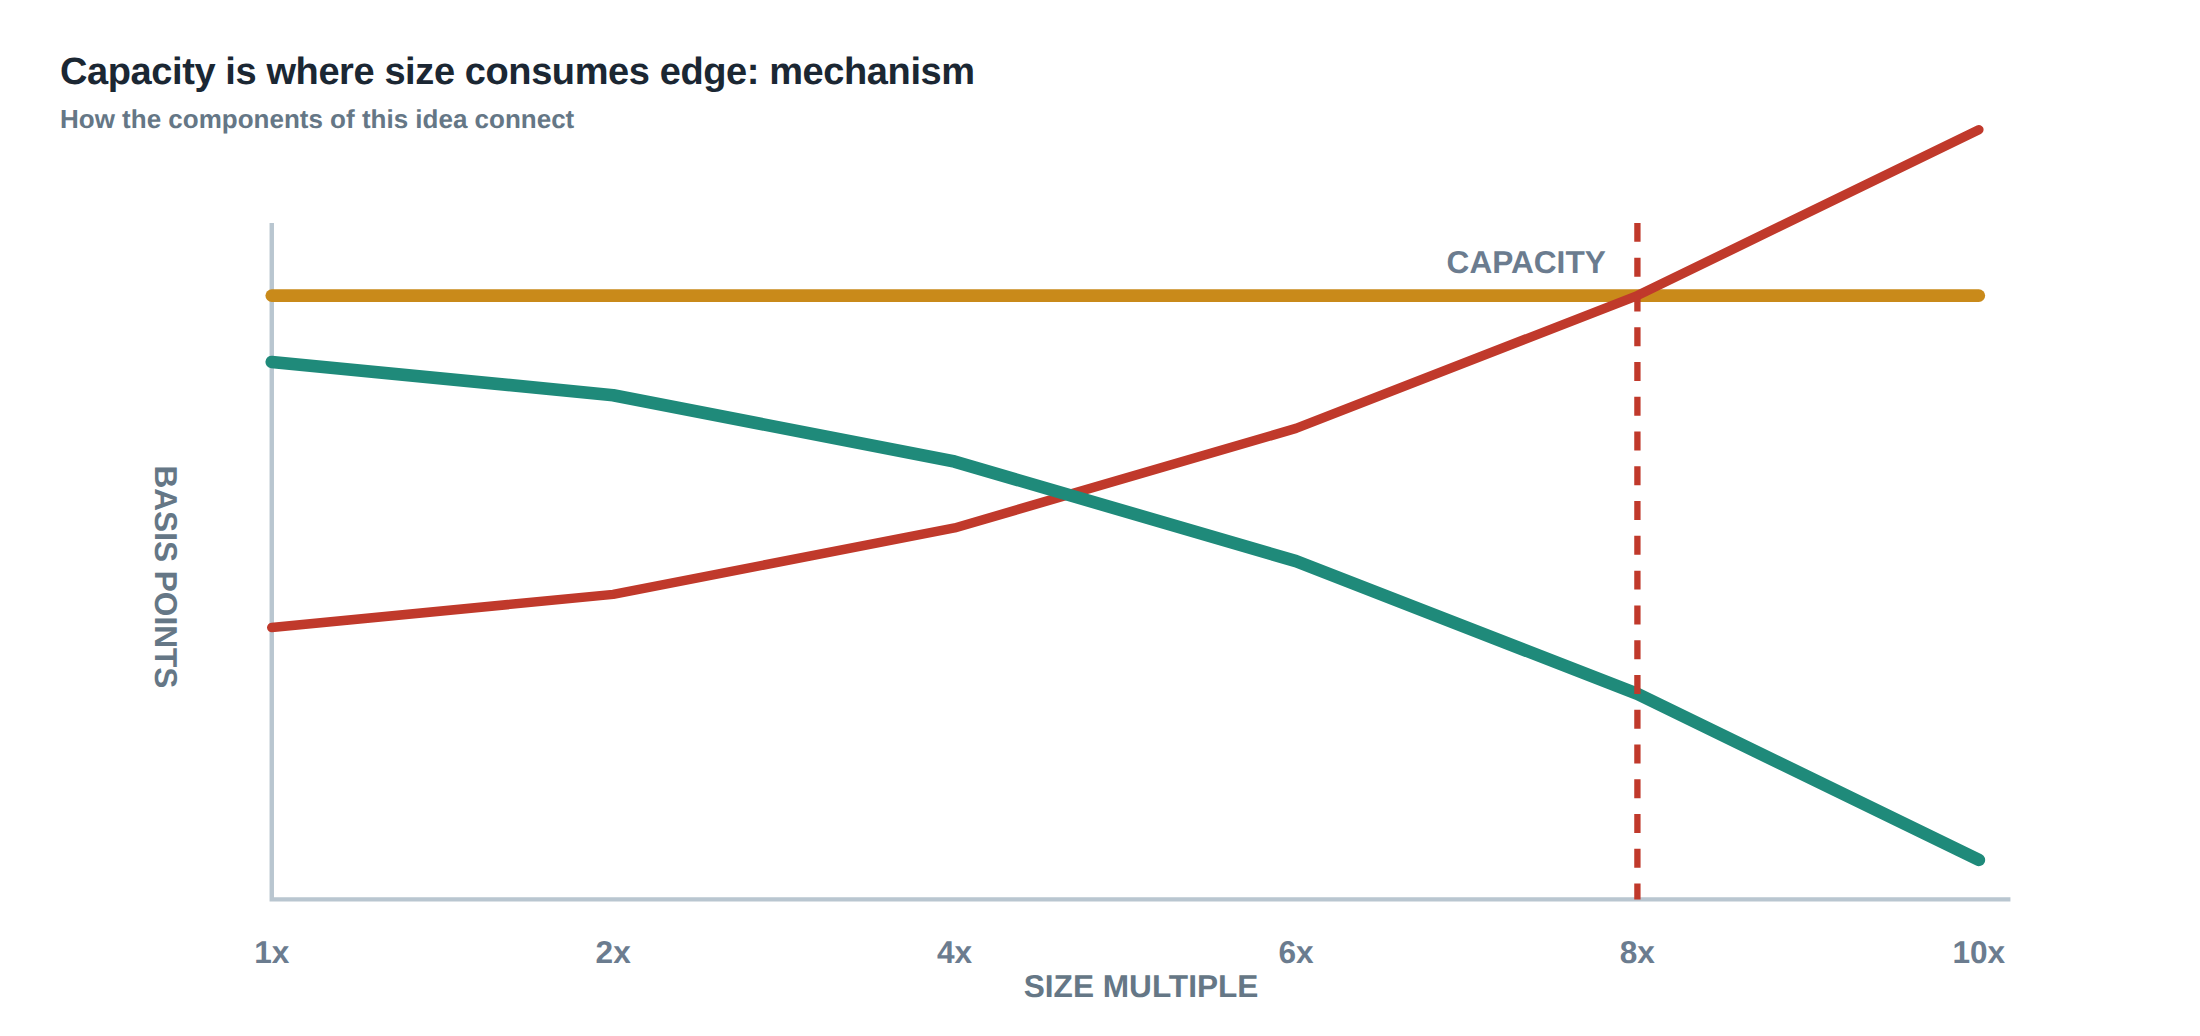
How the mechanism works, step by step
The first step is the placement of a limit order at the quoted best price. At that instant the order sits behind the existing queue and captures the quoted spread if it is executed without moving the mid‑price. The second step is the market’s response: other participants observe the growing queue, some may add liquidity, but many will withdraw, widening the spread and increasing the probability that a market order will “walk” through the queue.
The third step is the execution of the order. If the quantity is small, the trade is filled entirely at the quoted price and the realised cost is essentially the spread. As the quantity grows, the order begins to consume the depth at the best price and then at the next price level, incurring a temporary impact that is proportional to the square of the participation rate.
The fourth step is the permanent impact. The trade leaves a footprint that can shift the reference price for a few seconds to several minutes, depending on market depth and volatility. This shift reduces the expected profit of subsequent trades that rely on the same signal, creating an opportunity cost that is often omitted from naïve back‑tests.
Finally, the trader must decide whether to keep the order alive. The decision hinges on a comparison between the remaining expected spread capture, the rising adverse‑selection risk, and the cost of exiting early. If the expected net edge has turned negative, the optimal action is to cancel the order, even if the original signal has not yet decayed.
A worked example with real numbers
Consider a mean‑reversion strategy that places a buy limit order at the best ask on a liquid equity. The average daily volume (ADV) is 10 million shares, the quoted spread is 1 tick (0.01 USD), and the depth at the best ask is 5 000 shares. The strategy’s signal suggests a 0.15 % expected price move over the next 30 seconds, which translates to an expected gross edge of 1.5 USD per 1 000 shares (0.0015 × 1 000).
In the baseline case the order size is 1 000 shares, a 0.01 % participation rate. The order is fully filled at the best ask, incurring only the spread cost of 0.01 USD per share, i.e. 10 USD total. The net expected profit is therefore 1.5 USD × 1 000 / 1 000 – 10 USD = 1.5 USD – 10 USD = ‑8.5 USD, which is negative; however the strategy also benefits from the option value of retaining a queue position, estimated at 2 USD per 1 000 shares, bringing the net edge to + ‑6.5 USD.
Now double the order to 2 000 shares, raising the participation rate to 0.02 %. The first 5 000 shares at the best ask are still available, so the entire 2 000‑share order is filled at the best price, but the temporary impact cost rises with the square of participation. Empirically the impact coefficient for this instrument is 0.05 USD · √(participation). The temporary impact cost becomes 0.05 × √0.02 ≈ 0.007 USD per share, or 14 USD total for 2 000 shares.
Because the order now consumes the full depth at the best ask, the next 1 000 shares must be taken from the second price level, which is 2 ticks worse. That adds an extra 0.02 USD per share, i.e. 20 USD. The permanent impact, measured as a shift of the mid‑price, is estimated at 0.003 USD per share for this participation, adding another 6 USD. The spread cost doubles to 20 USD. Summing all components: spread 20 USD, temporary impact 14 USD, depth‑walk 20 USD, permanent impact 6 USD, total cost 60 USD.
The gross edge from the signal scales linearly with size: 0.15 % × 2 000 = 3 USD per share, or 6 USD total. Adding the queue‑value option of 2 USD per 1 000 shares gives 4 USD. Net expected profit is therefore 4 USD – 60 USD = ‑56 USD. The cost has more than doubled while the gross edge only doubled, illustrating how capacity can turn a modestly profitable signal into a losing proposition.
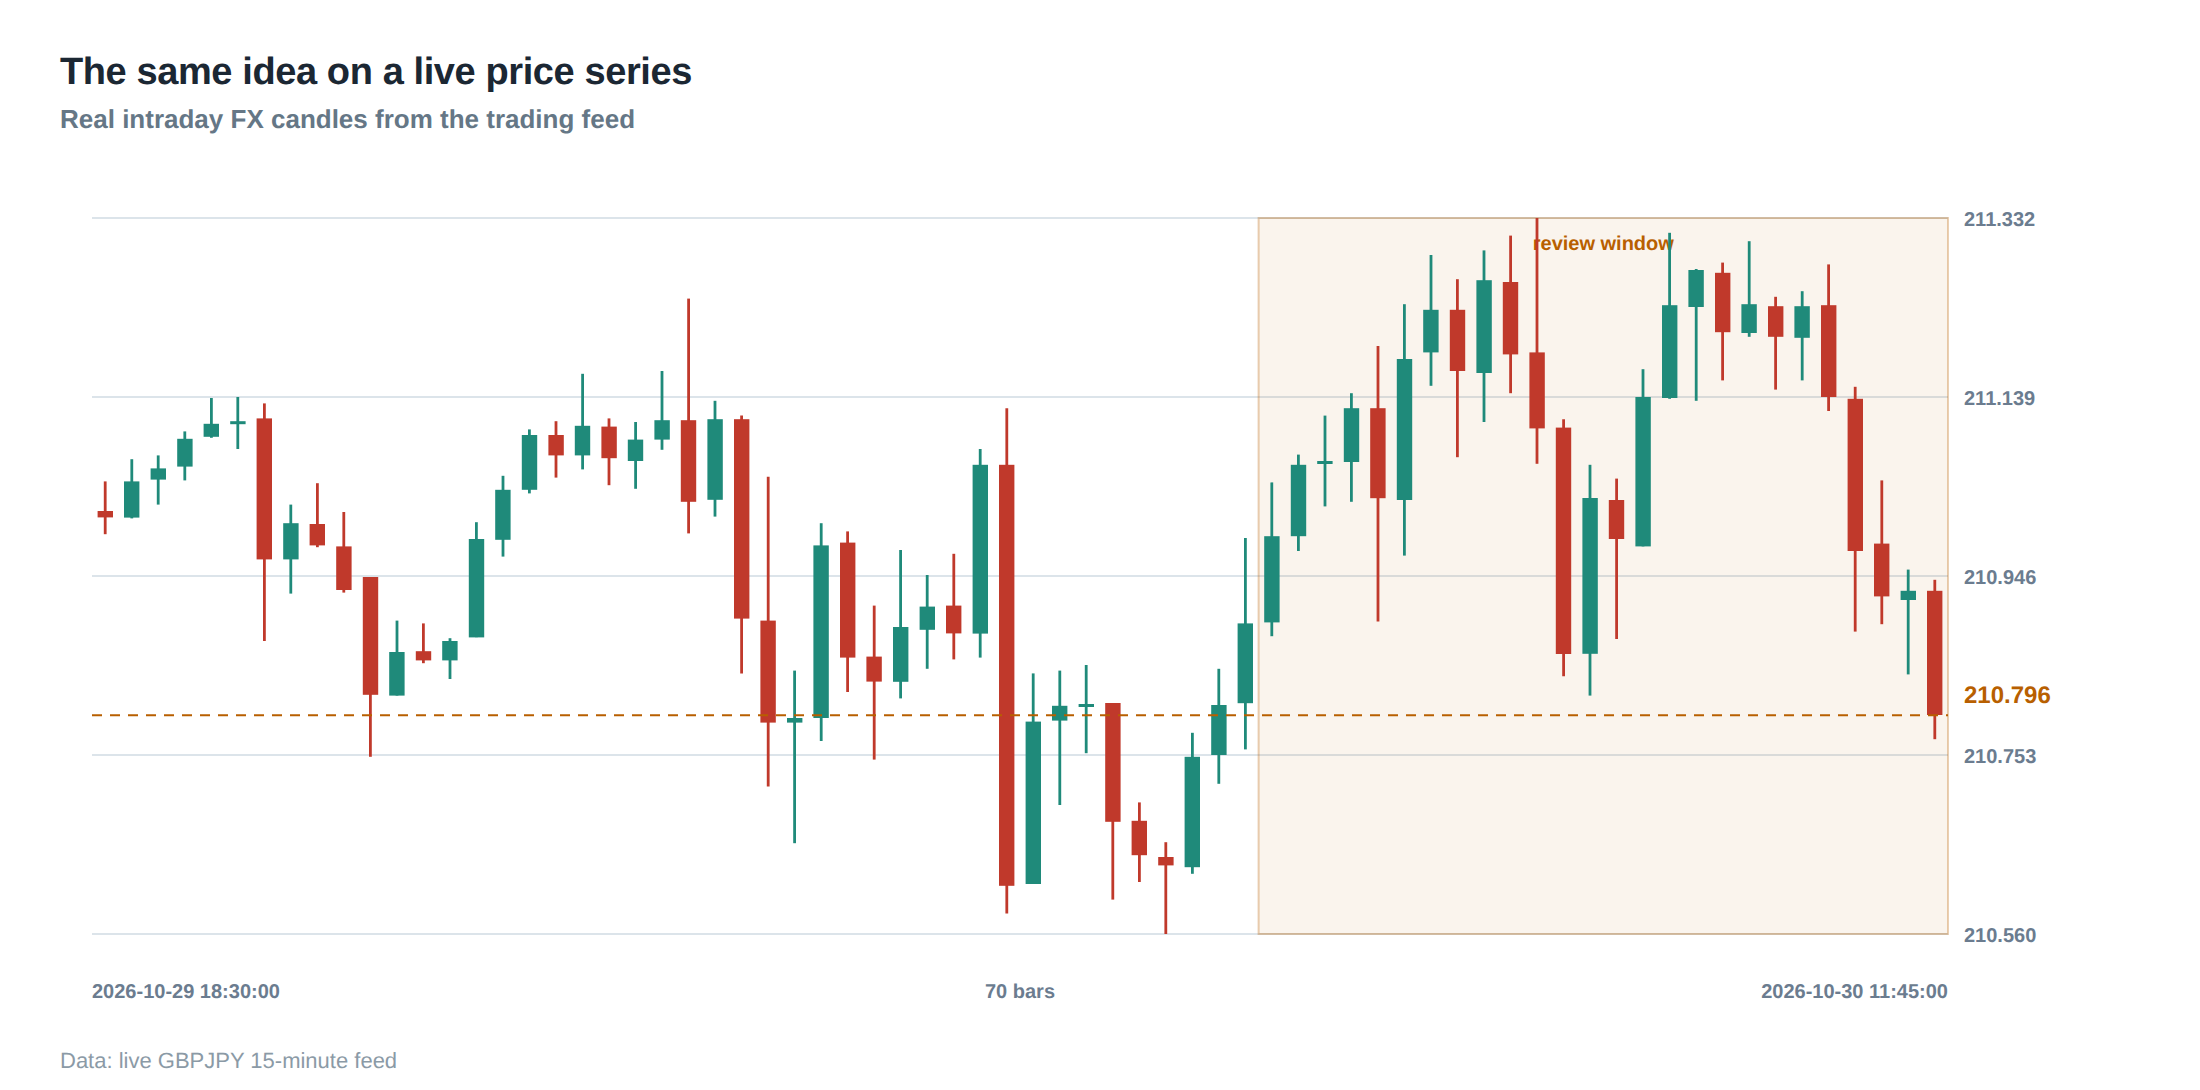
Where it breaks in live markets
The theoretical model assumes a static order‑book, yet real markets exhibit pronounced asymmetries during thin sessions, such as early Asian open or late US close. Liquidity providers withdraw, the depth at the best price can shrink to a few hundred shares, and volatility spikes, inflating both temporary and permanent impact. In those windows the participation rate that was acceptable a few minutes earlier can become prohibitive.
Urgent exits compound the problem. If a position must be liquidated within a few seconds because of a stop‑loss or a macro event, the trader is forced to cross the spread and walk the book, paying the full market impact on both sides. The opportunity cost of not being able to unwind at a favourable price can exceed the expected edge by an order of magnitude.
Another failure mode is the “queue‑race”. When many participants detect the same signal, they all push orders to the front of the queue, causing a rapid turnover of the best price. The order that arrives later may find the queue already depleted, forcing it to trade deeper or to cancel and miss the signal entirely. The queue‑value component therefore erodes in real time, and a static assessment of edge becomes obsolete within seconds.
The operating path, stage by stage
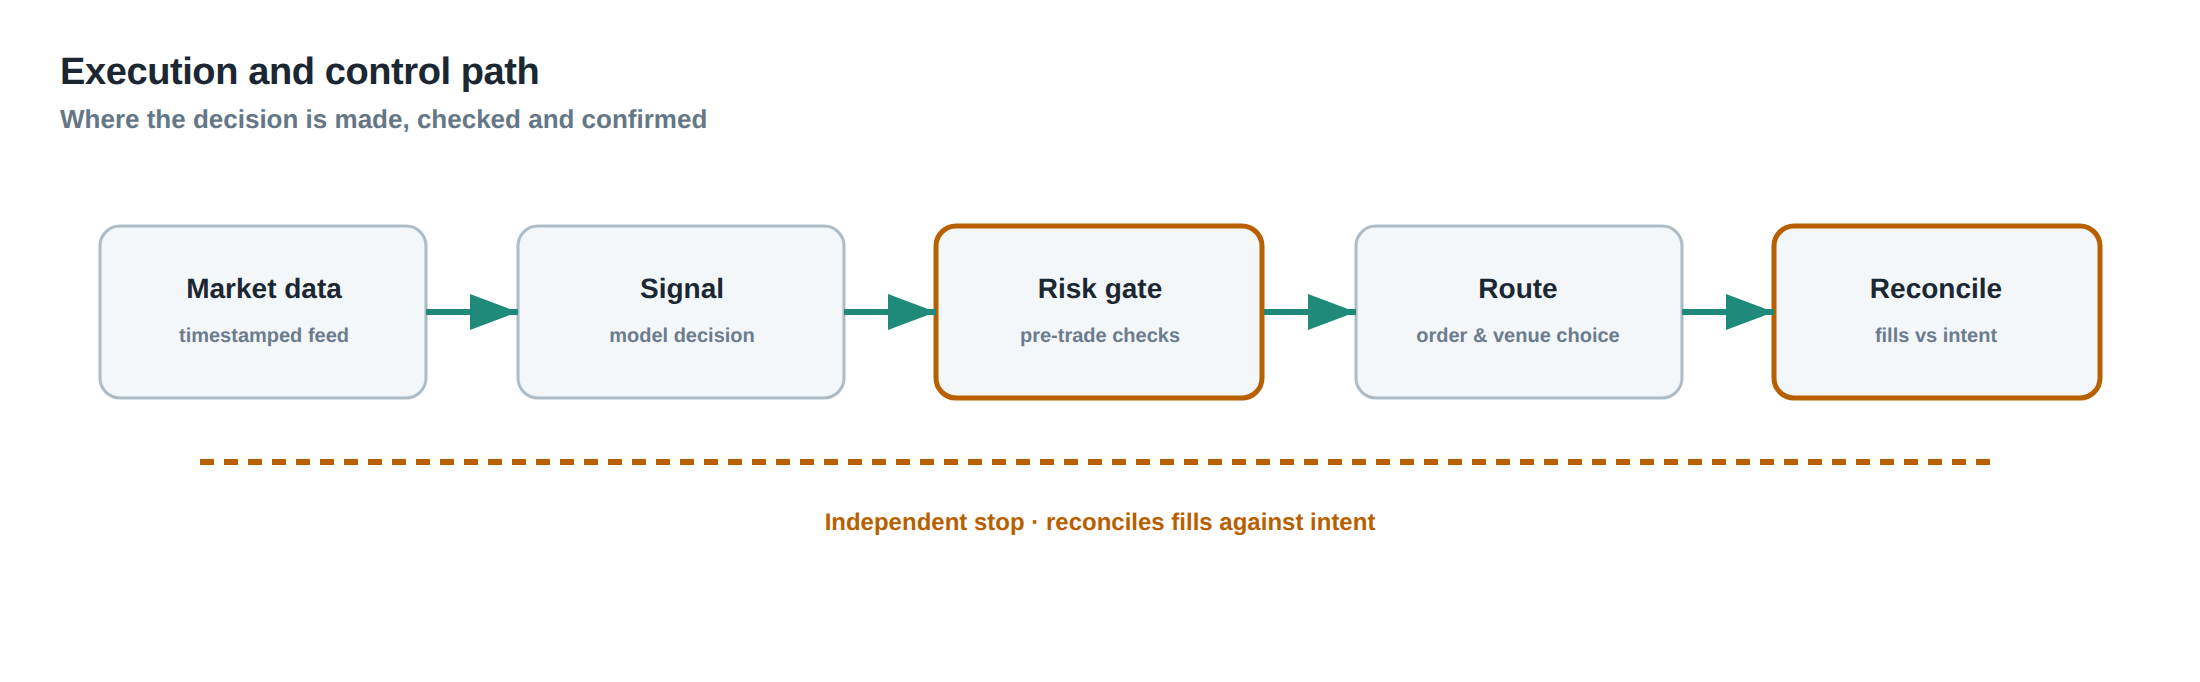
The first stage is signal generation and sizing. The trader calculates the theoretical edge and selects an initial participation rate based on historical capacity curves. The second stage is order placement, where the algorithm chooses between a passive limit, a pegged order, or an aggressive market order, guided by the current depth and volatility.
The third stage is monitoring. The system continuously measures the realised participation, the proportion of the order filled at each price level, and the deviation of the mid‑price from its pre‑trade level. When the realised temporary impact exceeds a pre‑set threshold, the algorithm flags the trade for possible early termination.
The fourth stage is decision. If the remaining expected spread capture, after accounting for the observed impact, falls below the sum of the queue‑value and the opportunity cost of staying in the market, the order is cancelled. Otherwise it is left to run until the signal expires or the target position is reached.
The final stage is post‑trade analysis. The realised cost components are compared with the modelled capacity curve. Discrepancies are fed back into the calibration of the impact coefficients, ensuring that the next iteration of the strategy respects the newly discovered capacity limit.
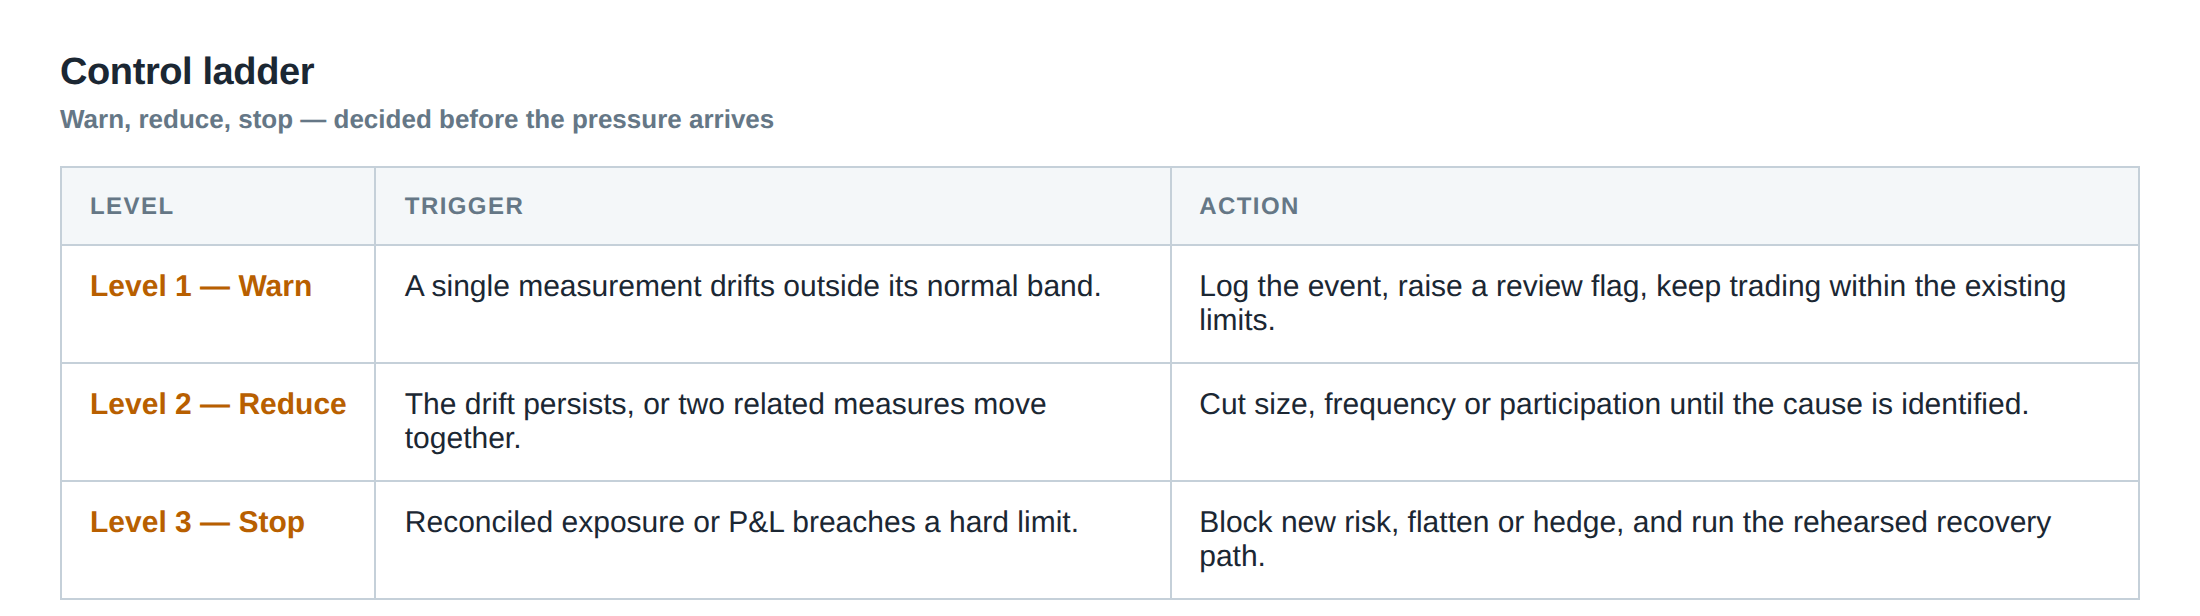
Controls that act before the damage
A robust control framework begins with a pre‑trade capacity test. The algorithm simulates the trade at incremental sizes, adding the modelled spread, temporary impact (proportional to the square of participation), permanent impact (linear in participation), and the opportunity cost of delayed execution. The simulation stops when the expected net edge reaches zero; that size becomes the hard limit for live execution.
During live trading a participation‑rate guard enforces the hard limit. If the market’s available depth at the best price falls below a fraction of the target size, the algorithm automatically scales the order down or switches to a more aggressive price level, thereby preventing a forced walk through the book.
A volatility filter acts as a second line of defence. When realised volatility exceeds a multiple of its recent average, the impact coefficients are inflated in real time, tightening the participation ceiling. This prevents the trader from inadvertently entering a high‑impact regime during news releases or macro‑driven spikes.
Finally, an exit‑urgency monitor watches for any breach of a predefined time‑to‑exit threshold. If a position remains open beyond the acceptable horizon, the system escalates to a market‑order unwind, accepting the cost of immediate execution rather than risking a larger permanent impact from a prolonged stale queue.
How to measure whether it is working
The primary metric is the realised net edge per trade, calculated as the sum of the spread capture, the queue‑value option, and any price‑move benefit, minus the observed temporary impact, permanent impact, and depth‑walk cost. This figure should be plotted against the participation rate for each trade; the resulting scatter should align with the pre‑trade capacity curve.
A second diagnostic is the slippage‑to‑capacity ratio. Slippage is the difference between the execution price and the quoted best price at order entry, expressed in basis points. Dividing this by the theoretical slippage predicted by the impact model yields a ratio that should hover around one. Persistent deviation indicates model misspecification or a shift in market microstructure.
The third indicator is the queue‑retention rate, i.e. the proportion of orders that remain in the book for more than a pre‑defined fraction of the signal horizon. A falling retention rate suggests that adverse‑selection risk is rising faster than the model anticipates, prompting a recalibration of the option‑value component.
All three metrics are aggregated at the daily and weekly level to detect drift. If the average net edge trends toward zero while the signal’s statistical strength remains unchanged, the capacity limit must be lowered. Conversely, if the realised edge consistently exceeds the model, the limit can be cautiously nudged upward, provided the impact coefficients are re‑validated on fresh data.
The portfolio view
Capacity is a portfolio‑wide constraint, not merely a per‑instrument issue. When multiple strategies share the same venue or the same underlying liquidity pool, their combined participation can push the market into a regime where each individual strategy’s edge collapses. Therefore the desk must monitor the aggregate participation rate across all active signals, weighting each by its estimated impact coefficient.
Cross‑asset correlation of impact is also relevant. A large buy order in a highly correlated futures contract can induce a permanent price shift in the underlying equity, inflating the permanent impact component of a seemingly unrelated equity strategy. The portfolio risk engine should therefore incorporate a matrix of impact spill‑overs, updating the capacity curves in real time as the net exposure evolves.
Risk budgeting becomes a matter of allocating the total allowable participation budget among strategies in proportion to their marginal contribution to expected net edge. Strategies that generate high edge at low participation are favoured, while those that are edge‑dense but impact‑heavy are throttled or scheduled for execution during deeper market periods.
By treating capacity as a shared resource, the desk can avoid the paradox where each strategy, when examined in isolation, appears viable, yet the combined activity erodes the edge of all. The result is a more stable, scalable portfolio that respects the physical limits of the market rather than the abstract limits of the back‑test.
In practice, the capacity framework should be embedded in the order‑management system, with live dashboards that display the current aggregate participation, the remaining capacity buffer, and the real‑time deviation of realised slippage from the capacity curve. When the buffer shrinks below a pre‑set safety margin, the system automatically throttles the most impact‑intensive strategies until the buffer is restored.
—
Is the size of your next order still within the capacity that preserves the edge you have measured?
About the research behind this lesson
The seminar frames electronic markets as price-time-priority queues. It separates queue value into spread capture versus adverse-selection cost and the option value of retaining a place in line.
Applied to this lesson: An order lifetime therefore cannot be based on elapsed time alone: the system must reassess whether its queue position, expected spread and adverse-selection risk still justify keeping the order alive.
Two live systems, one desk
PULSE-X — power-packed HFT: high-frequency momentum on XAUUSD and EURUSD. System details · Live account
NIC-X — ultra-low drawdown: displaced-print arbitrage for large capital. System details · Live account
Start now: leave your email and request a free trial — we will send the pricing, the connection route and the trial terms. Pricing
Join the market discussion: Telegram @squawklive
Source: High-Frequency Trading and Modern Market Microstructure
Educational content only. Trading leveraged products involves risk.
Chat with XTRSK
Chat ready
Start a chat and the XTRSK team will be notified immediately.