
XCore HFT / Trading Lab
XCore HFT Trading Lab: Drawdown controls should change behaviour
Quantitative execution, market-microstructure, and risk-control research from XTRSK.
A clean backtest can hide a messy execution problem. Live markets expose the difference immediately. Drawdown controls should change behaviour.
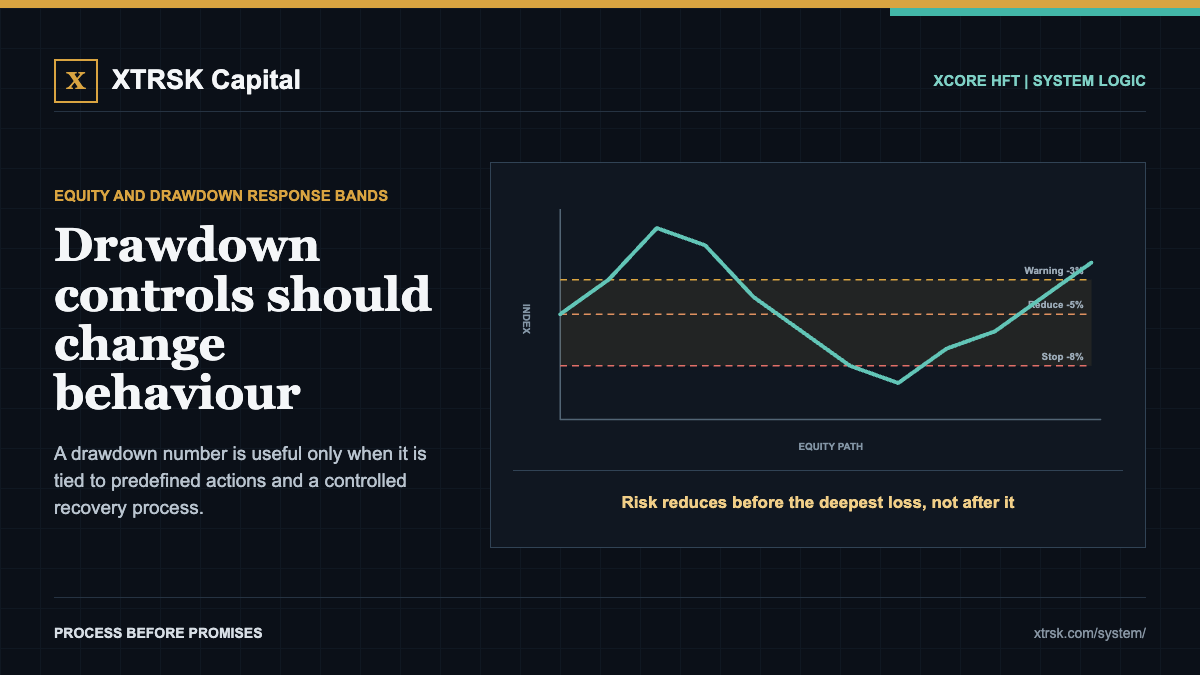
The useful analysis follows each state transition from observation to final exposure. A drawdown number is useful only when it is tied to predefined actions and a controlled recovery process. Use warning, de-risking and shutdown thresholds. Prevent size from automatically increasing to recover losses. In production, drawdown, tail risk, risk and liquidity must describe evidence rather than aspiration.
Put a boundary around the claim. Reducing risk after a threshold can preserve optionality; doubling size to recover faster can turn a model issue into ruin. The example is not a forecast or a promise; it shows which variable must be measured before the apparent opportunity can be treated as usable.
A compact operating checklist is: 1) require evidence before restoring full risk; 2) track time under water as well as depth; 3) measure peak-to-trough loss at strategy and portfolio level. Add hard exposure ceilings, observable rejection reasons and an event trail that lets operations reconstruct the decision without guessing. Control sequence: 1 signal, 1 order path, 1 reconciled risk state.
The common mistake is to optimise the visible number and ignore the conditions that produced it. Review the median, the stressed tail and the failure path separately. A result that survives only in quiet sessions, tiny size or perfect data is a research result, not yet a production capability.
The account experiences combined profit, loss and liquidity demand, even when models are monitored in separate dashboards. The objective is not to remove uncertainty. It is to size uncertainty, detect when assumptions break and preserve the ability to stop without creating a second problem.
Which tail metric has taught you more than the corresponding average?
#Drawdown #RiskManagement
The research behind this lesson
This paper explains Andrew Lo's lectures build risk analysis from return distributions and statistical measures, rather than treating one realised result as a complete description of risk.
Applied to this XCore lesson: For a fast strategy, median latency or average fill quality is not enough. The review has to include tail delays, stale-order frequency and the loss distribution when cancellation or routing behaves abnormally.
Explore XCore HFT: System details
PULSE XCORE HFT live account: Verify the live account on FX Blue
Live chat and updates: Telegram @xtrskhft
Source: Risk and Return
Educational content only. Trading leveraged products involves risk.
Chat with XTRSK
Chat ready
Start a chat and the XTRSK team will be notified immediately.