
How September CPI Surprises Shape Quantitative Trading Edge Calculations
Research preview
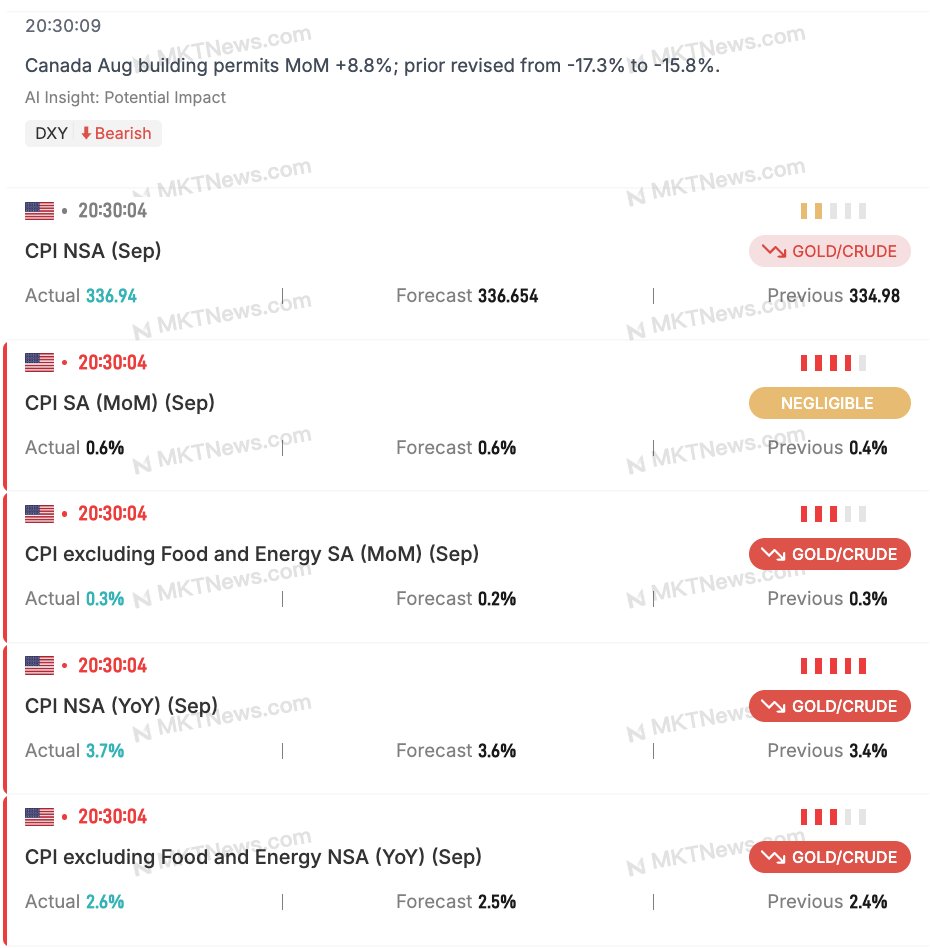
The U.S. consumer price index for September came in hotter than expected, with both year‑over‑year and month‑over‑month figures above consensus. For systematic traders, such macro releases create short‑lived price dislocations that can be captured with well‑designed models. This article walks through the mechanics of turning a CPI surprise into a quantifiable trading edge, illustrates the cost structure that erodes that edge, and outlines concrete steps to embed the insight into a live strategy. Understanding the CPI Data Shock The headline CPI rose 3.7 % year‑over‑year, beating the 3.6 % estimate and the 3.4 % reading from the prior month....
Client research
Register free or login to read the full report
Registration is free. The full report includes chart snapshots, level work, technical tables, catalyst context, and the complete desk read.
Chat with XTRSK
Chat ready
Start a chat and the XTRSK team will be notified immediately.