
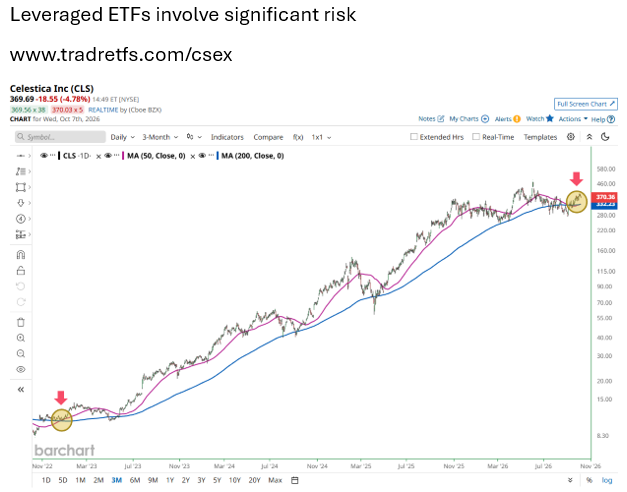
How to Evaluate Celestica’s New Golden Cross and Leverage It with a 2X Daily ETF
Research preview
Celestica’s stock has just produced a golden‑cross pattern for the first time since late 2022, a technical signal that previously preceded a dramatic rally. Traders seeking systematic exposure must ask whether the historical relationship will repeat, and how to size a position when using a leveraged daily ETF. This article walks through the statistical reasoning, back‑testing pitfalls, and risk controls that a quantitative trader should apply before committing capital. The Golden Cross as a Statistical Event A golden cross occurs when a short‑term moving average, typically the 50‑day simple moving average (SMA), rises above a longer‑term moving average, commonly the 200‑day SMA....
Client research
Register free or login to read the full report
Registration is free. The full report includes chart snapshots, level work, technical tables, catalyst context, and the complete desk read.
Chat with XTRSK
Chat ready
Start a chat and the XTRSK team will be notified immediately.