
XCore HFT / Trading Lab
DMA gives control and responsibility
Quantitative execution, market-microstructure, and risk-control research from XTRSK.
What this problem really is
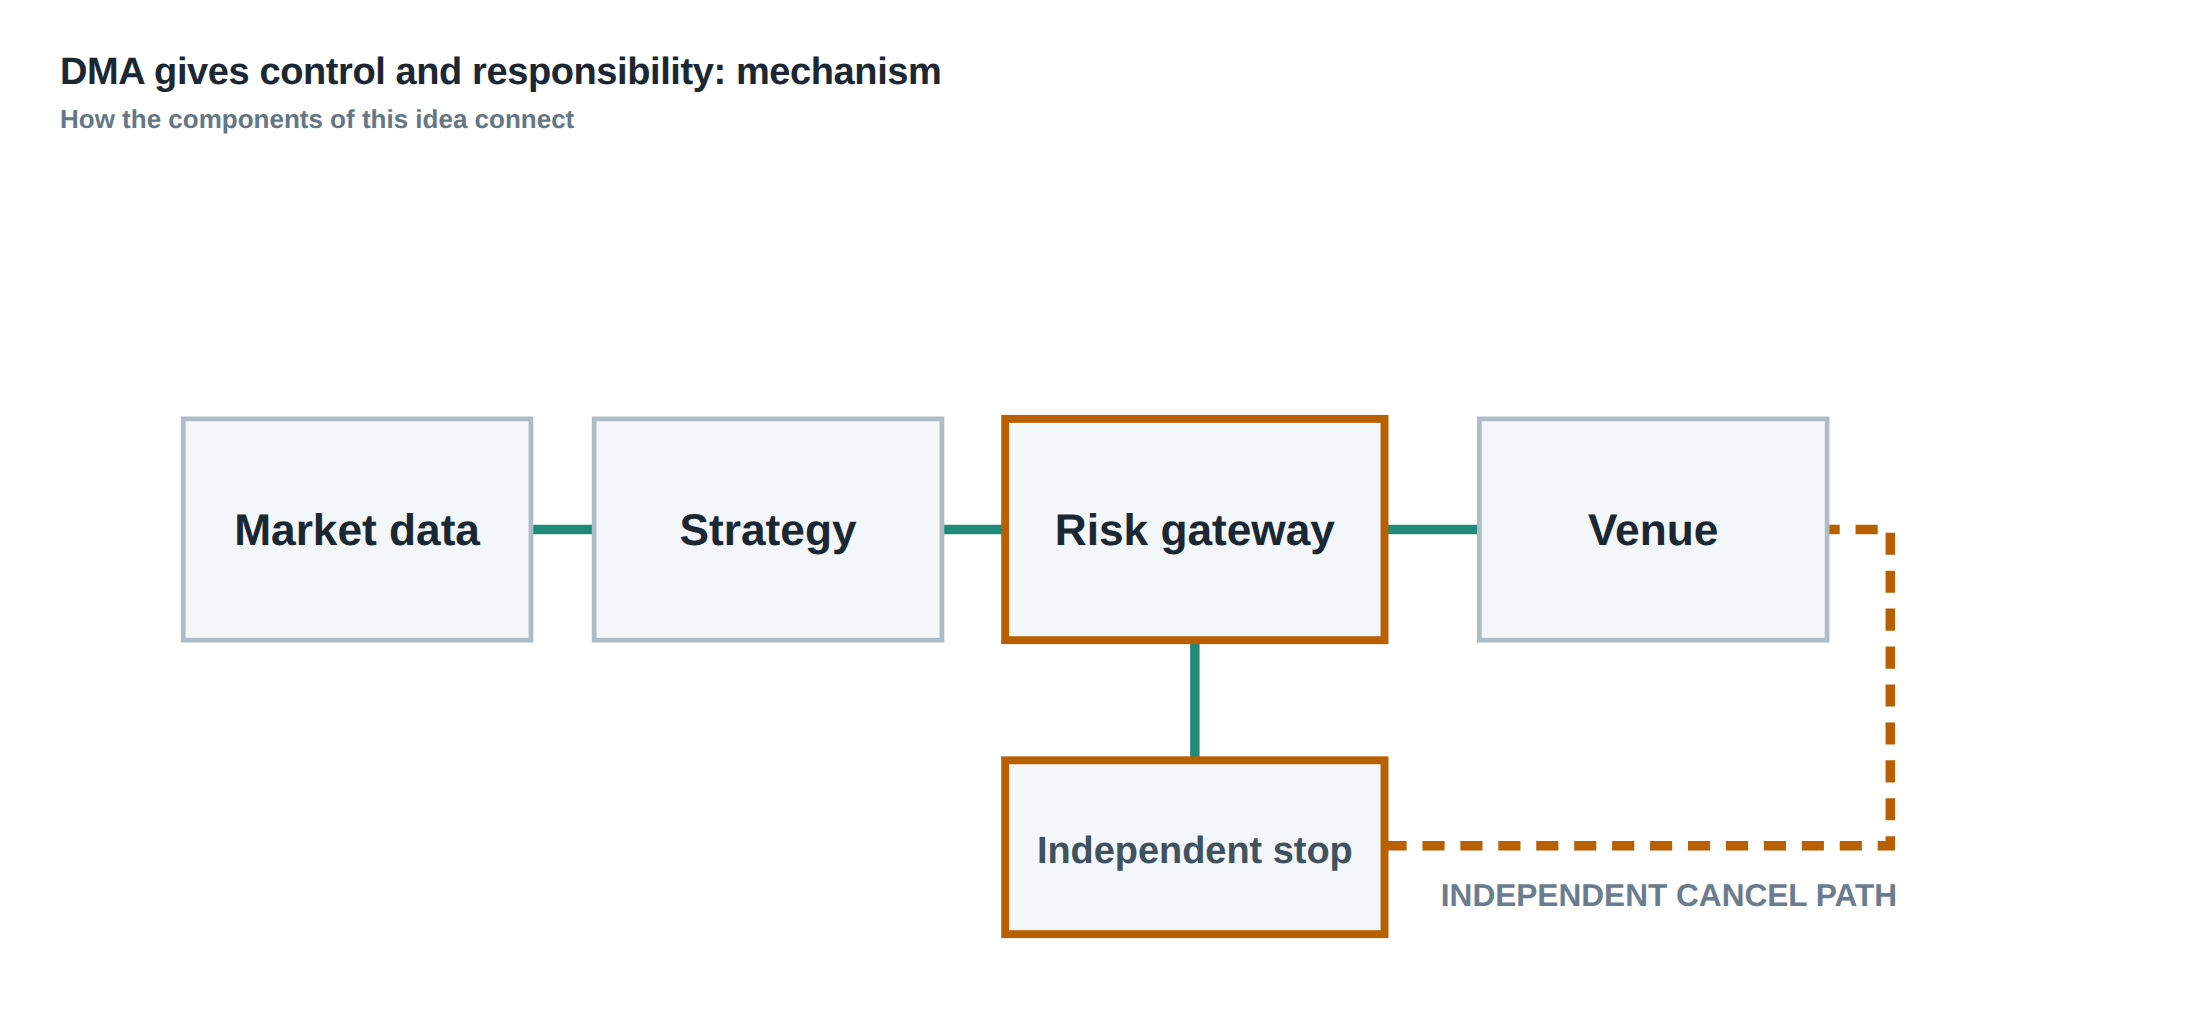
Direct market access (DMA) is often described as the removal of an intermediary, a way of sending an order straight from a proprietary trading desk to the exchange’s order‑matching engine. In practice the “intermediary” is more than a simple broker screen; it is a suite of pre‑trade checks, risk‑limits, and supervisory processes that have been built up over years of operating in a regulated environment. When a firm elects to bypass that screen, the responsibility for those checks shifts from the broker to the firm itself. The problem, therefore, is not simply a technical shortcut but a reallocation of operational risk. The firm must now guarantee that every order that leaves its gateway is correctly formed, complies with internal limits, and can be withdrawn instantly if market conditions change. Failure to do so can generate “fat‑finger” incidents, unintended large notional exposure, or regulatory breaches that are far more costly than the savings achieved by removing a broker layer.
The underlying market structure amplifies this risk. Electronic venues run price‑time‑priority queues: an order’s value is a mixture of the spread it hopes to capture, the adverse‑selection cost of being front‑run, and the optionality of staying in line. The moment an order is placed, the firm has committed capital to a position in that queue. If the order is not continuously reassessed against its evolving queue position, expected spread and adverse‑selection risk, the order may linger far longer than is justified, exposing the firm to unnecessary market impact and capital drag. In a DMA environment the firm must provide the logic that a broker would normally supply, and it must do so with the speed and reliability demanded by high‑frequency strategies.
How the mechanism works, step by step
When a strategy decides to trade, it first constructs a message containing the instrument identifier, side (buy or sell), price, quantity and the account to which the trade should be charged. This message is handed to the order‑management layer, which validates the syntax, checks that the instrument is enabled for the strategy, and confirms that the account has sufficient margin. Only after these checks does the message move to the risk‑engine, where it is measured against a series of limits: a per‑order notional ceiling, a daily exposure cap, a frequency threshold that prevents more than a prescribed number of orders per second, and a duplicate‑order detector that flags identical messages within a short window. If any of these tests fail, the order is rejected locally and a rejection message is logged.
Assuming the order passes, it is placed onto a transmission queue that is coupled to a low‑latency network interface. The gateway stamps the message with a sequence number and a timestamp, then forwards it to the exchange’s matching engine. The exchange returns an acknowledgement (ACK) that the order has been received, followed later by execution reports (fills) or cancellation confirmations. Each of these downstream messages is routed back through the same gateway, where they are matched against the original outbound sequence. The system must reconcile every ACK, fill, cancel and reject, updating the internal position book and the risk‑engine in real time. If a fill is received that exceeds the original quantity, or if an ACK is missing, the reconciliation logic raises an alarm and may trigger an automatic kill switch.
The kill path is a separate, pre‑tested route that can be invoked without involving the strategy process. It consists of a minimal set of instructions – typically a “cancel all” message that is sent directly to the exchange with the highest possible priority. This path is exercised in simulation and on live traffic to confirm that it can terminate all outstanding orders within a bounded time, usually measured in milliseconds. Because the kill path bypasses the normal order‑flow logic, it must be insulated from any software bugs that could arise in the strategy code, ensuring that the firm can always regain control of its exposure.
A worked example with real numbers
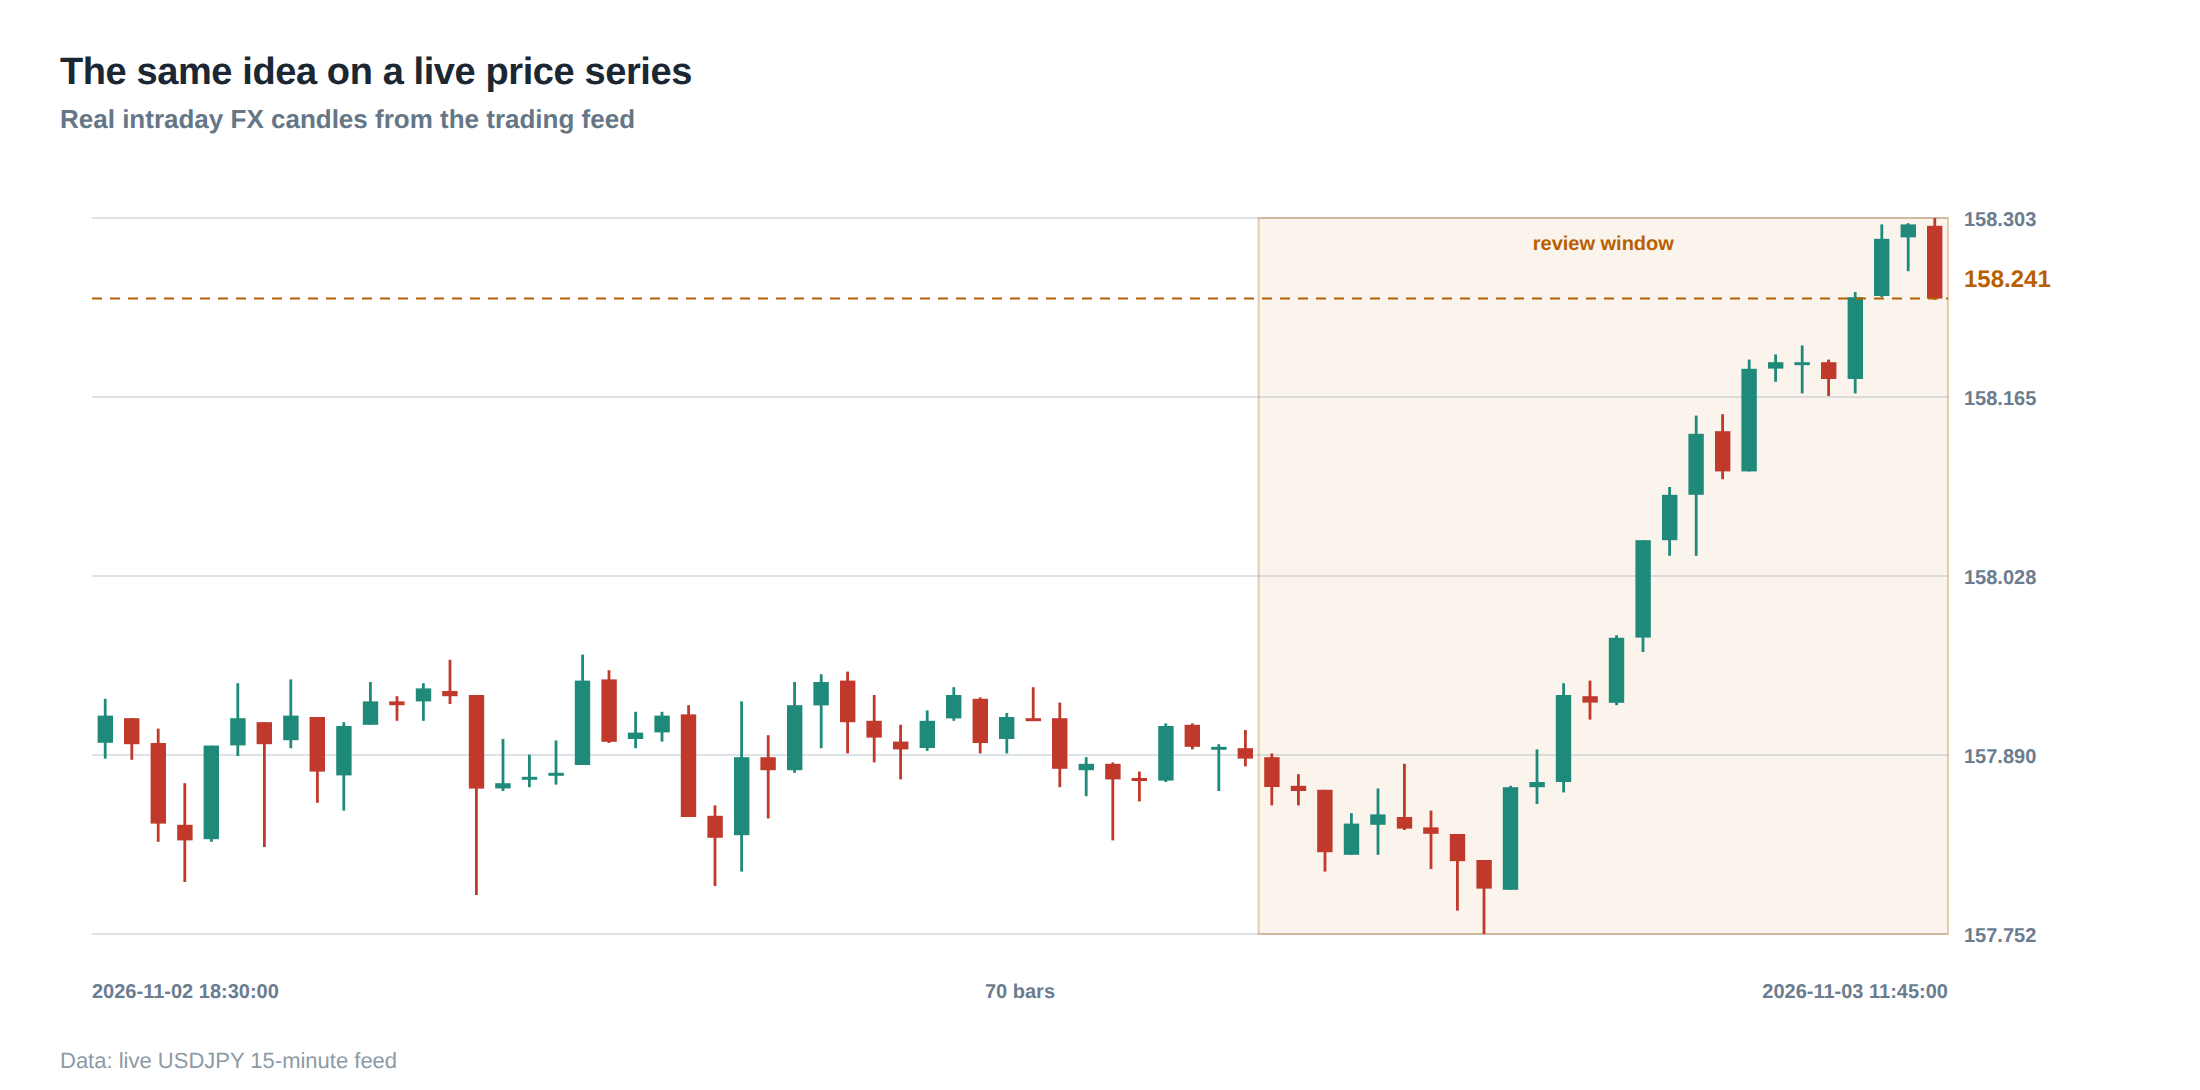
Consider a statistical arbitrage strategy that monitors the EUR/USD and GBP/USD pairs and places a spread‑capture order on the EUR/USD market. At 09:30:12.345 the strategy generates a buy order for 2 million EUR at 1.0805, to be executed against the best offer. The internal pre‑trade checks first verify that the symbol “EURUSD” is enabled, that the side is “buy”, and that the price lies within the market‑wide band of 1.0750‑1.0900. The quantity of 2 million is converted to a notional of USD 2 161 000 (2 000 000 × 1.0805). The risk‑engine then applies a per‑order notional limit of USD 5 million, a daily exposure ceiling of USD 30 million, and a frequency limit of 10 orders per second. Because the order is the fifth one in the current second, it passes the frequency test. A duplicate‑order filter checks the last 500 ms and finds no identical order, so the order proceeds.
The gateway stamps the message with sequence 00123 and timestamp 09:30:12.347, then sends it to the exchange. The exchange acknowledges receipt at 09:30:12.350 with an ACK containing the same sequence number. At 09:30:12.362 the exchange matches the order against a resting sell at 1.0805 and sends a fill report for 1 million EUR. The gateway updates the internal position to +1 million EUR, reduces the remaining quantity to 1 million, and forwards the fill to the risk‑engine, which recalculates the net exposure to USD 1 080 500. Two seconds later, at 09:30:14.018, the exchange reports a second fill for the remaining 1 million EUR at the same price. The total notional realised is USD 2 161 000, exactly the amount the strategy intended to capture. All acknowledgements, fills and the final “order complete” message are reconciled against the outbound sequence, and the order is marked as closed in the internal book.
Now imagine a sudden market move at 09:30:15.000 that pushes the best offer to 1.0820, widening the spread beyond the strategy’s target. The kill path is invoked automatically because the risk‑engine detects that the expected spread capture has fallen below the threshold of 4 bps. A “cancel all” message is sent directly to the exchange with priority flag “high”. The exchange confirms cancellation at 09:30:15.003. The entire round‑trip, from detection to kill, took 3 ms, well within the firm’s defined maximum of 5 ms for emergency exits. This example demonstrates that even though the broker screen was omitted, the firm retained full pre‑trade control and an independent supervision mechanism capable of terminating exposure in real time.
Where it breaks in live markets
In a live environment the most common failure points are timing mismatches and incomplete validation. When latency spikes, an order may sit in the transmission queue longer than anticipated, causing the market price to move away from the intended level. If the system does not reassess the order’s queue position, it may inadvertently capture an adverse price, turning a spread‑capture trade into a loss. Another frequent breakdown is the loss of acknowledgement messages due to network packet loss; without a reliable ACK the reconciliation engine cannot confirm that the order was accepted, leading to “orphan” orders that sit on the exchange without the firm’s knowledge.
Human error in configuration also resurfaces when DMA is introduced. Fat‑finger incidents often arise from a missing decimal point in the price field, for example entering 108.05 instead of 1.0805, which multiplies the notional by a factor of 100. If the pre‑trade validator does not enforce a price‑range check relative to the market best, such an order can be transmitted and filled before the error is detected. Duplicate‑order detection can fail when order IDs are reused across strategy restarts, allowing the same order to be sent twice and creating unintended double exposure.
Finally, the kill path can become ineffective if it shares any code paths with the normal order flow. A software bug that corrupts the message‑formatting routine may prevent the “cancel all” from being correctly encoded, resulting in the exchange ignoring the request. Because the kill path is supposed to be independent, any coupling to the broader system defeats its purpose and leaves the firm exposed to runaway positions.
The operating path, stage by stage
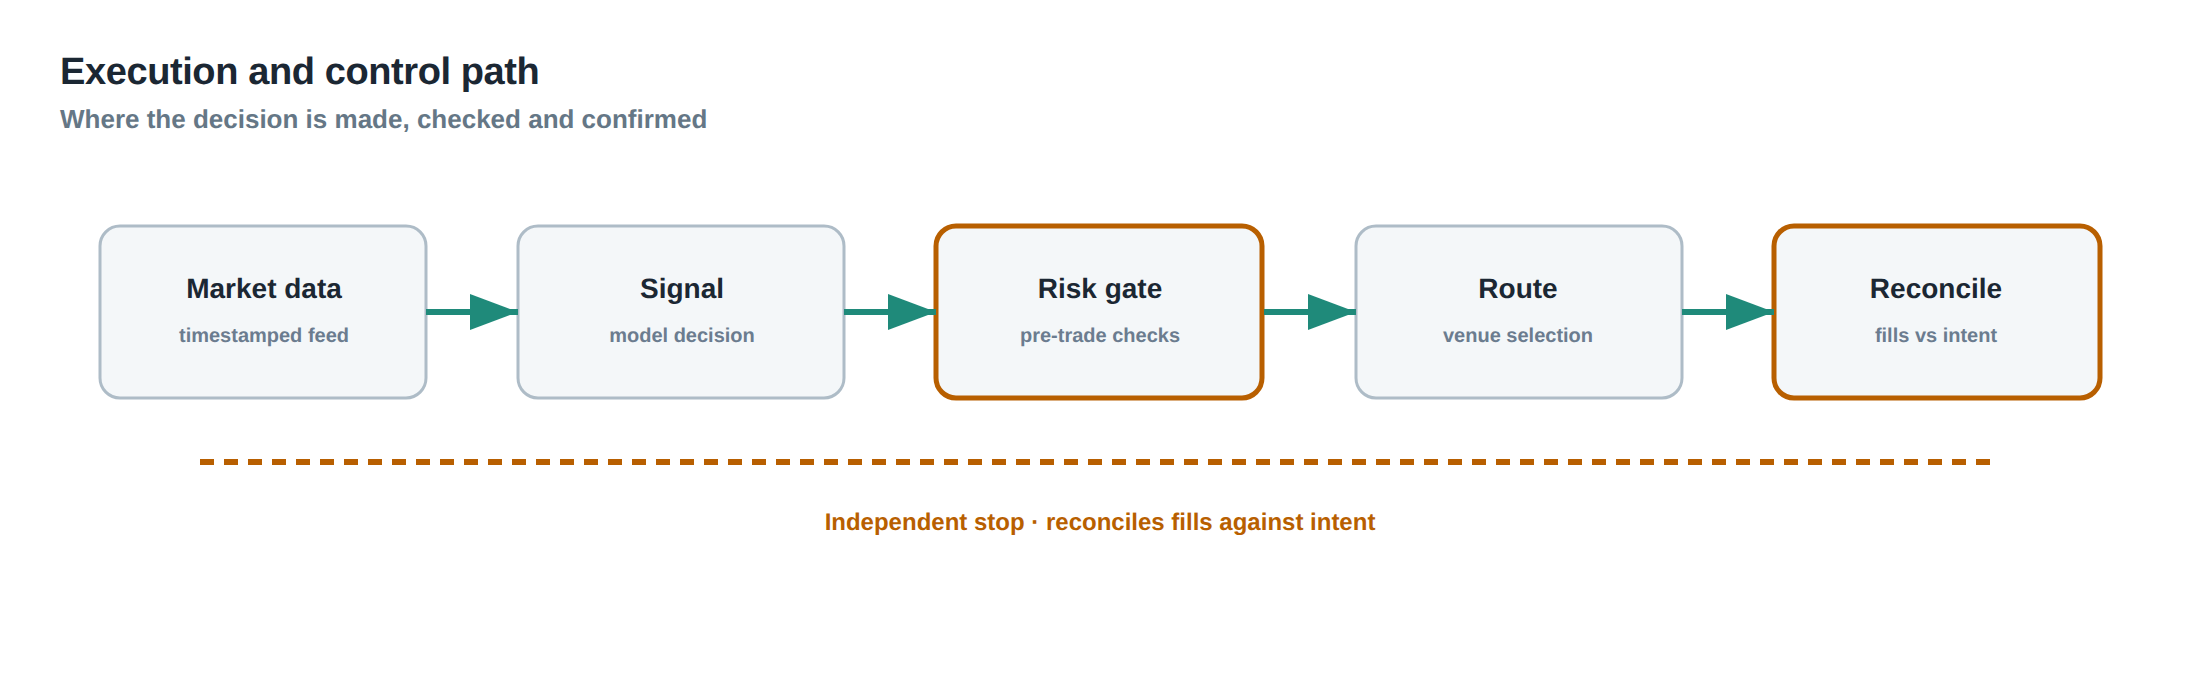
The first stage is the strategy output, where raw trade intent is emitted as a data structure containing the instrument, side, price, quantity and account. This output is handed to a sanitisation layer that checks for malformed fields, missing values and out‑of‑range parameters. The second stage is the risk‑engine, which evaluates the order against a hierarchy of limits: per‑order notional, aggregate exposure, order‑frequency, and duplicate detection. If the order passes, it is passed to the gateway’s outbound queue, where it receives a unique sequence identifier and a high‑resolution timestamp. The third stage is the network interface, which transmits the order over a low‑latency fibre or microwave link to the exchange’s gateway. The fourth stage is the exchange acknowledgement, where the order is either accepted, rejected or placed on the queue; the acknowledgement is routed back to the gateway and matched to the original sequence number. The fifth stage is the execution report stage, where fills, partial fills, or cancellations are reported; each report updates the internal position book and triggers a risk‑engine re‑evaluation of remaining exposure. The final stage is the post‑trade reconciliation, where the system audits that every outbound message has a corresponding inbound counterpart, flagging any mismatches for manual review.
Controls that act before the damage
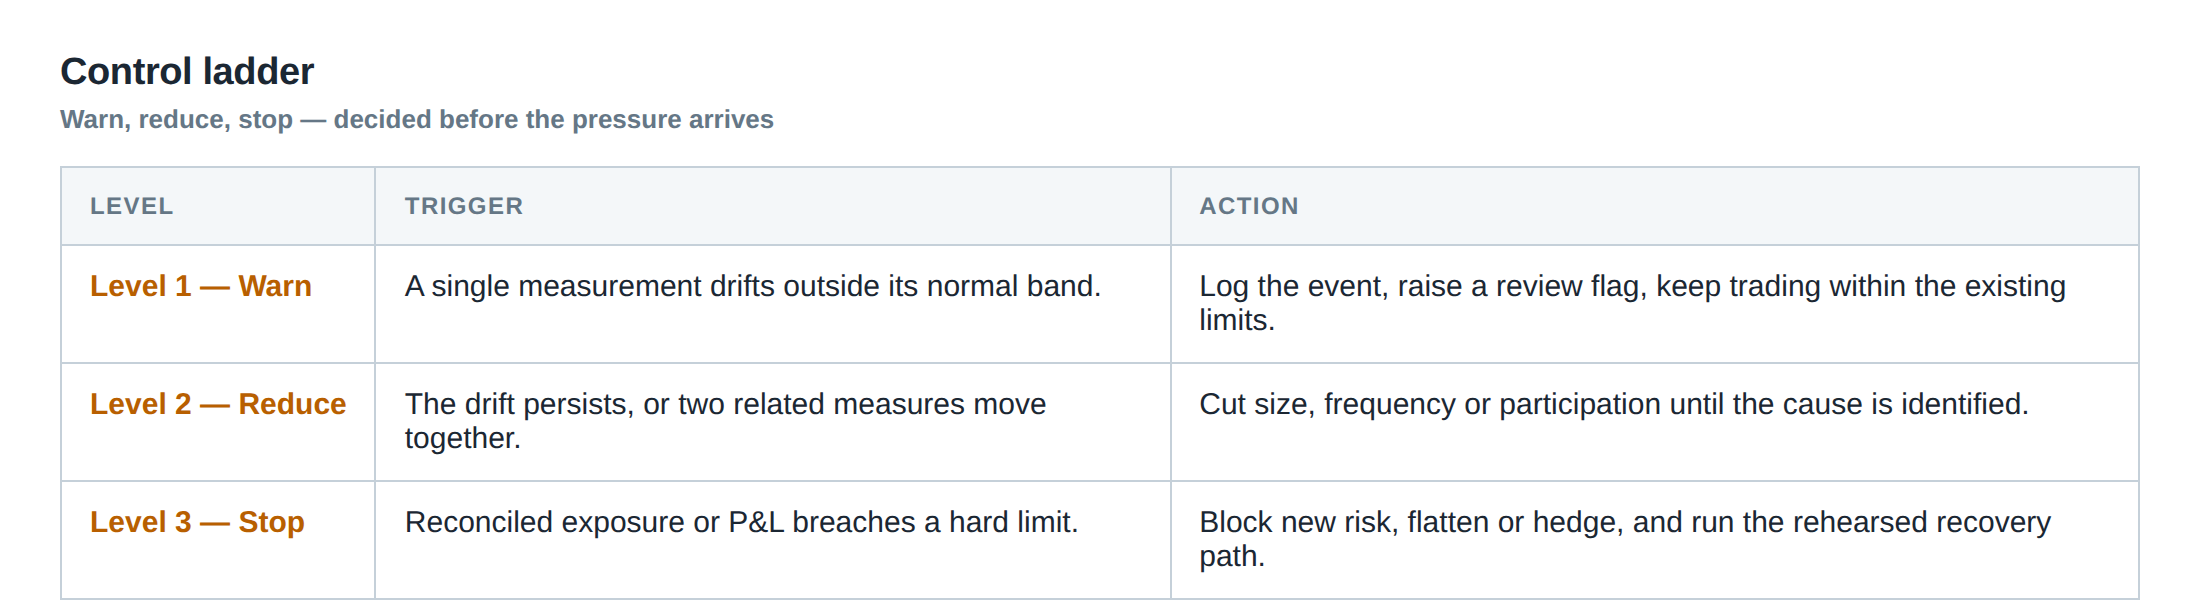
Pre‑trade validation begins with symbol verification against a master instrument list that includes trading status, lot size and price bands. The side field is checked for admissible values, and the price is compared to the latest market data snapshot to ensure it lies within a configurable deviation, typically a few basis points, from the best bid or offer. Quantity is validated against minimum and maximum lot sizes, and the resulting notional is computed to enforce a per‑order cap, for example USD 5 million. An additional fat‑finger guard examines the number of decimal places and the magnitude of the price relative to the instrument’s typical range; an order that deviates by more than a factor of ten is automatically rejected.
Frequency limits are implemented as a sliding‑window counter that tracks the number of orders per second per strategy, per instrument, and per account. If the count exceeds the configured threshold, the order is queued for manual review or dropped outright. Duplicate detection maintains a short‑term hash of recent order signatures; any order that matches an existing signature within a 200 ms window triggers a duplicate alarm and is blocked. All these checks are executed in a deterministic, single‑threaded path to avoid race conditions that could allow an invalid order to slip through under high load.
The kill path is a separate process that monitors the risk‑engine output for breach conditions such as exposure exceeding a hard limit, adverse‑selection metrics crossing a threshold, or a market‑wide circuit‑breaker activation. When a breach is detected, the kill process constructs a minimal cancel‑all message that contains only the exchange‑assigned order identifiers and a priority flag. Because it bypasses the normal order‑submission stack, it can be sent directly to the exchange’s control channel, guaranteeing delivery even if the primary gateway is congested.
How to measure whether it is working
Effectiveness is measured by a combination of latency statistics, error rates and control‑coverage metrics. The round‑trip time from order creation to acknowledgement should be logged for every message; the 99th percentile latency must stay below the firm’s target, for example 2 ms, and any outlier beyond a defined tail (e.g., 5 ms) should trigger an alarm. The fill‑to‑order ratio indicates whether orders are being executed as intended; a sudden drop may suggest that orders are being rejected or cancelled by the exchange due to malformed parameters. Reconciliation success is expressed as a percentage of outbound messages that have a matching inbound counterpart; a rate below 99.9 % signals a breakdown in the acknowledgment or fill pipeline.
Control‑coverage is audited by counting the number of orders that passed each pre‑trade check versus the total order volume. If the fat‑finger guard logs a rejection, the incident is recorded and the false‑positive rate is evaluated to ensure the guard is not overly aggressive. The kill‑path latency is measured by injecting simulated breach events and timing the interval from detection to exchange confirmation of cancellation; the measured value must be consistently below the firm’s emergency‑exit ceiling, typically 5 ms. Finally, a periodic stress test that floods the gateway with orders at the maximum permitted frequency validates that the frequency limiter and duplicate detector hold under peak load.
The portfolio view
From the portfolio perspective, DMA changes the risk profile from a relatively static, broker‑mediated exposure to a dynamic, self‑managed one. The firm now carries the full operational risk of order‑submission errors, latency spikes and reconciliation mismatches, which can translate into unexpected P&L swings across the whole book. However, the ability to fine‑tune pre‑trade controls and to intervene instantly with an independent kill path provides a higher degree of capital efficiency. By eliminating the broker screen, the firm reduces the average order‑to‑execution latency, which directly improves the expected spread capture component of queue value. At the same time, the firm must allocate resources to maintain a robust validation and monitoring stack, and to conduct regular audits of the kill‑path reliability. The net effect is a tighter coupling between strategy performance and operational discipline; the portfolio’s realised returns become a more accurate reflection of the underlying algorithmic ideas rather than of external friction.
Do you have the processes in place to guarantee that every DMA order is validated, monitored and, if necessary, killed faster than the market can erode its expected value?
About the research behind this lesson
The seminar frames electronic markets as price-time-priority queues. It separates queue value into spread capture versus adverse-selection cost and the option value of retaining a place in line.
Applied to this lesson: An order lifetime therefore cannot be based on elapsed time alone: the system must reassess whether its queue position, expected spread and adverse-selection risk still justify keeping the order alive.
Two live systems, one desk
PULSE-X — power-packed HFT: high-frequency momentum on XAUUSD and EURUSD. System details · Live account
NIC-X — ultra-low drawdown: displaced-print arbitrage for large capital. System details · Live account
Start now: leave your email and request a free trial — we will send the pricing, the connection route and the trial terms. Pricing
Join the market discussion: Telegram @squawklive
Source: High-Frequency Trading and Modern Market Microstructure
Educational content only. Trading leveraged products involves risk.
Chat with XTRSK
Chat ready
Start a chat and the XTRSK team will be notified immediately.