XCore HFT / Trading Lab
A kill switch is a system, not a button
Quantitative execution, market-microstructure, and risk-control research from XTRSK.
What this problem really is
In a high‑frequency prop desk the “kill switch” is often imagined as a single emergency button that, when pressed, stops all loss‑making activity. In practice the term hides a suite of coordinated controls that must act on three distinct layers: the individual strategy, the trading account that houses the strategy, and the firm‑wide infrastructure that underpins every algorithm. Each layer has its own risk‑budget, its own set of open orders, and its own exposure profile. A naïve button that merely halts a single process does not address the residual risk that lives in the order books of external venues, in the positions of a hedging engine, or in the state of a downstream clearing system. The problem is therefore not “press a button” but “orchestrate a system‑wide transition from a live, risk‑bearing state to a safe, auditable state without leaving stray orders or hidden positions behind.”
The core of the difficulty lies in the asynchronous nature of modern electronic markets. An algorithm may generate dozens of limit orders per second, each holding a place in a price‑time priority queue. Those queues confer an option value – the right to capture the spread if the market moves favourably – but they also expose the trader to adverse selection if the queue is jumped. When a failure occurs, the decision to keep an order alive cannot be based on the wall‑clock time it has been sitting; it must be based on the residual option value of the queue position versus the expected cost of adverse selection. A proper kill switch therefore needs to evaluate that trade‑off for every order that remains in the market at the instant of the emergency.
How the mechanism works, step by step
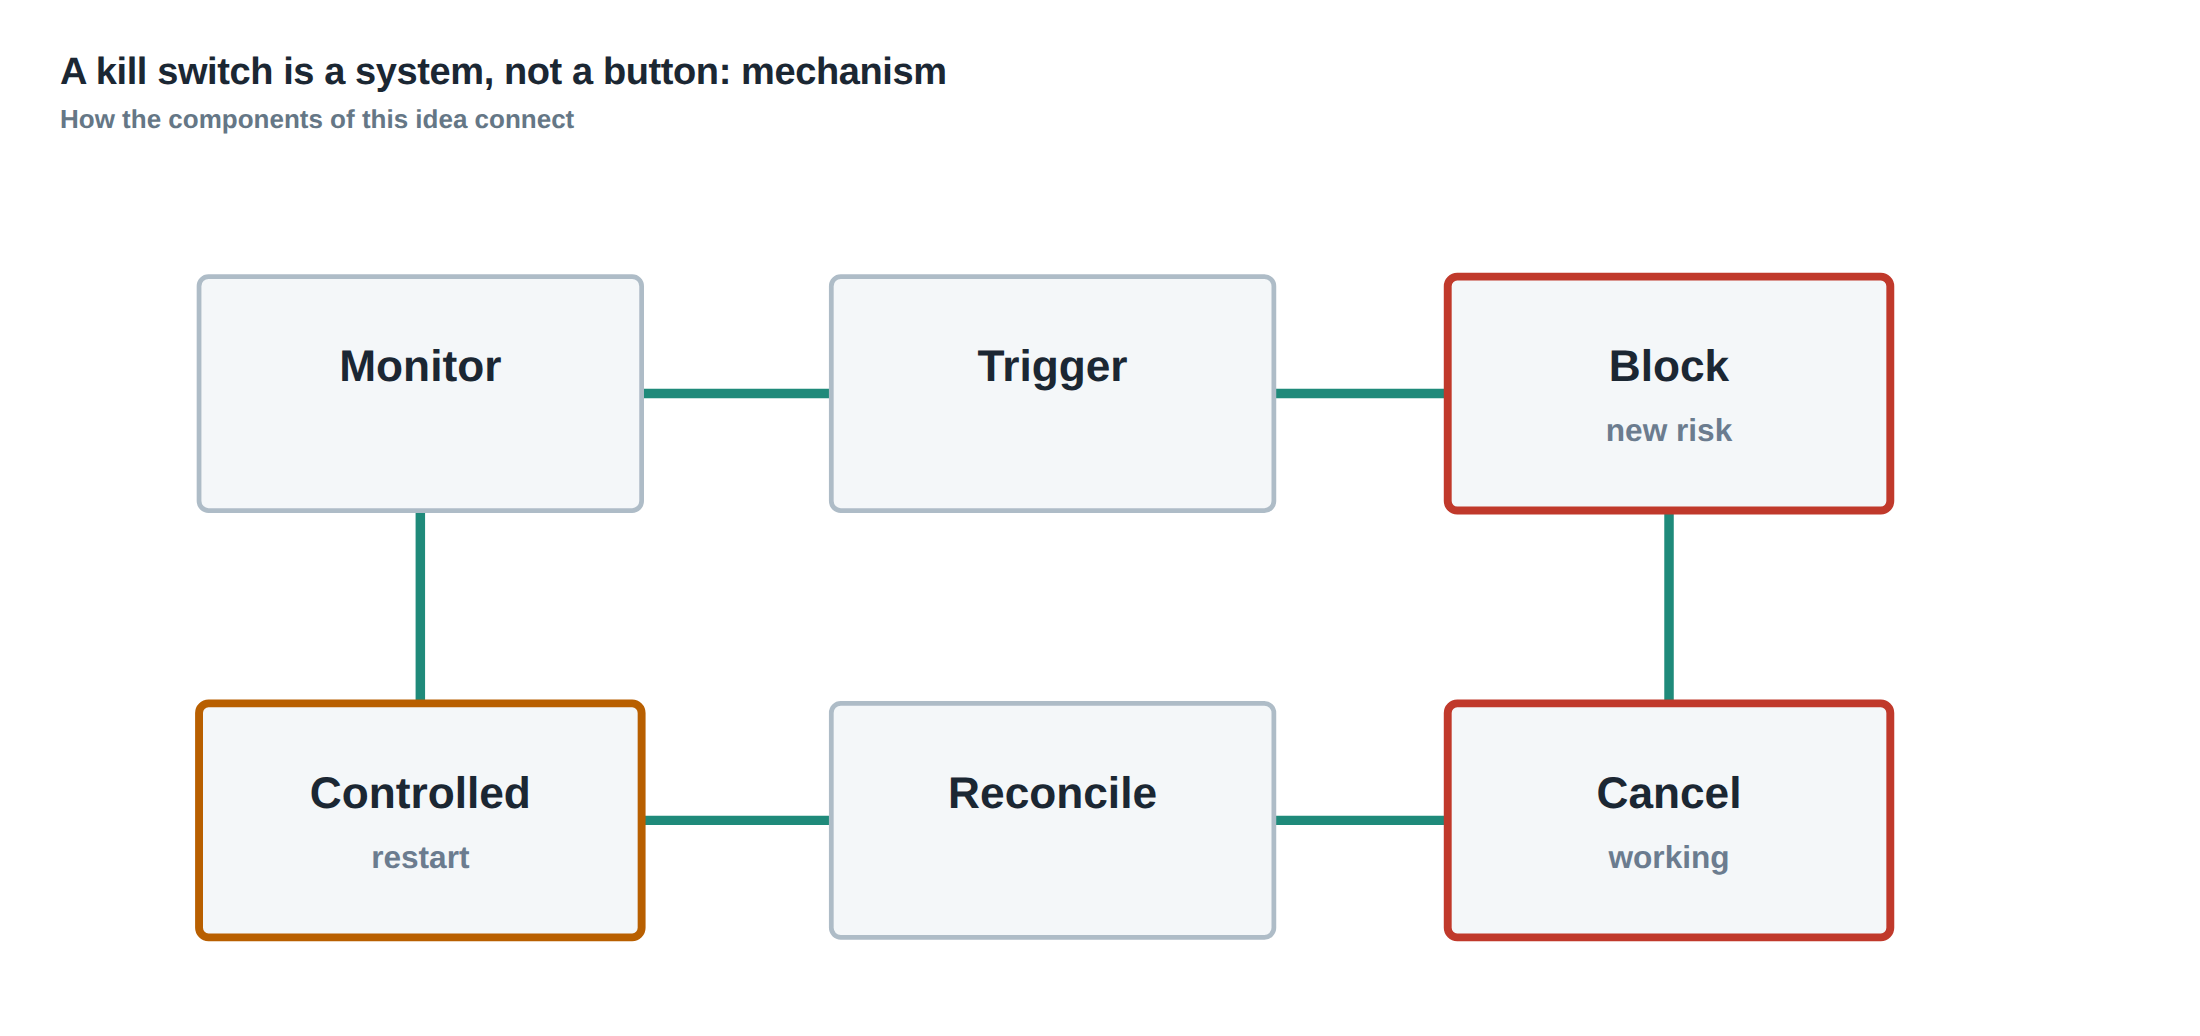
The first step is to detect a trigger condition. Triggers may be internal – a watchdog timer exceeding a latency budget, a loss‑of‑heartbeat from a market data feed – or external – a regulator‑mandated market halt, a cyber‑security breach alert. Once a trigger fires, the system raises a “stop request” that propagates through three parallel channels: strategy‑level, account‑level and firm‑level.
At the strategy level the request is interpreted by a local risk manager that decides whether to cancel pending orders, to flatten existing positions, or to do both. Cancellation simply removes the order from the exchange queue; flattening sends a marketable order to unwind the current position. The decision is driven by a rule‑set that weighs the expected spread capture of each order against the estimated adverse‑selection cost if the market moves against the order while the kill switch is executing.
The account‑level controller aggregates the outputs of all strategies belonging to the same capital allocation. It checks whether any strategy has elected only to cancel but not flatten, and whether the net exposure after cancellation still exceeds the account‑wide risk limit. If it does, the account controller upgrades the action to a full flatten, ensuring that the aggregate delta, gamma or vega exposure falls below the pre‑defined threshold.
The firm‑level controller receives the same stop request and validates that the request originates from an authorised source. It then disables any new order submission paths across the entire infrastructure, isolates the affected network segment, and logs the event with a tamper‑evident audit trail. Only after the firm‑level acknowledgement does the system consider the emergency “closed.”
Finally, each layer sends an acknowledgement back to the originator. The originator will only report success when it has received a positive acknowledgement from all three layers, confirming that no new risk can be generated, that all existing risk has been dealt with, and that the control is now in a known safe state.
A worked example with real numbers
Consider a market‑making strategy on the EUR/USD spot market that maintains a 10‑tick bid‑ask spread. The algorithm holds a 1 million‑unit bid order at 1.1020 and an ask order of the same size at 1.1021. Simultaneously it runs a hedge leg on a futures contract, short 1 million units at the current futures price of 1.1025. The hedge is intended to offset delta exposure if the spot moves against the quoted spread.
At 09:15:23.456 a latency watchdog detects that the market‑data feed from the primary venue has been silent for 150 ms, exceeding the 100 ms threshold. The watchdog raises a stop request.
The strategy controller evaluates the two limit orders. The bid order has been in the queue for 2.4 seconds; the expected spread capture, based on historic fill probability, is 0.12 USD per unit, i.e. 120 USD total. The adverse‑selection risk, estimated from recent order‑book imbalance, is 0.08 USD per unit, i.e. 80 USD. Because the net expected profit (40 USD) is still positive, the controller decides to cancel the bid but to flatten the ask, as the ask sits at the top of the book and could be hit within a millisecond.
The account controller receives the strategy’s actions. After the bid cancellation the net spot exposure is –1 million units (short), matched by the futures hedge which is also short 1 million units. The aggregate delta is therefore –2 million units, exceeding the account’s delta limit of 1.5 million units. The account controller upgrades the action to a full flatten of the hedge leg, sending a marketable order to buy back the futures contract.
The firm‑level controller, after confirming the request originates from the authorised risk‑engine process, disables the order‑submission API for the entire desk, isolates the affected server rack, and writes a signed log entry.
When the acknowledgements return, the originator reports success. The final state is: the ask order removed, the bid order cancelled, the futures position closed, and no new orders can be generated. The total realised P&L from the emergency actions is –120 USD (ask fill) + 0 USD (bid cancellation) – 2 USD (futures unwind slippage), i.e. a loss of 122 USD, far smaller than the potential adverse‑selection loss that would have accrued if the market moved 5 ticks against the unflattened position.
Where it breaks in live markets
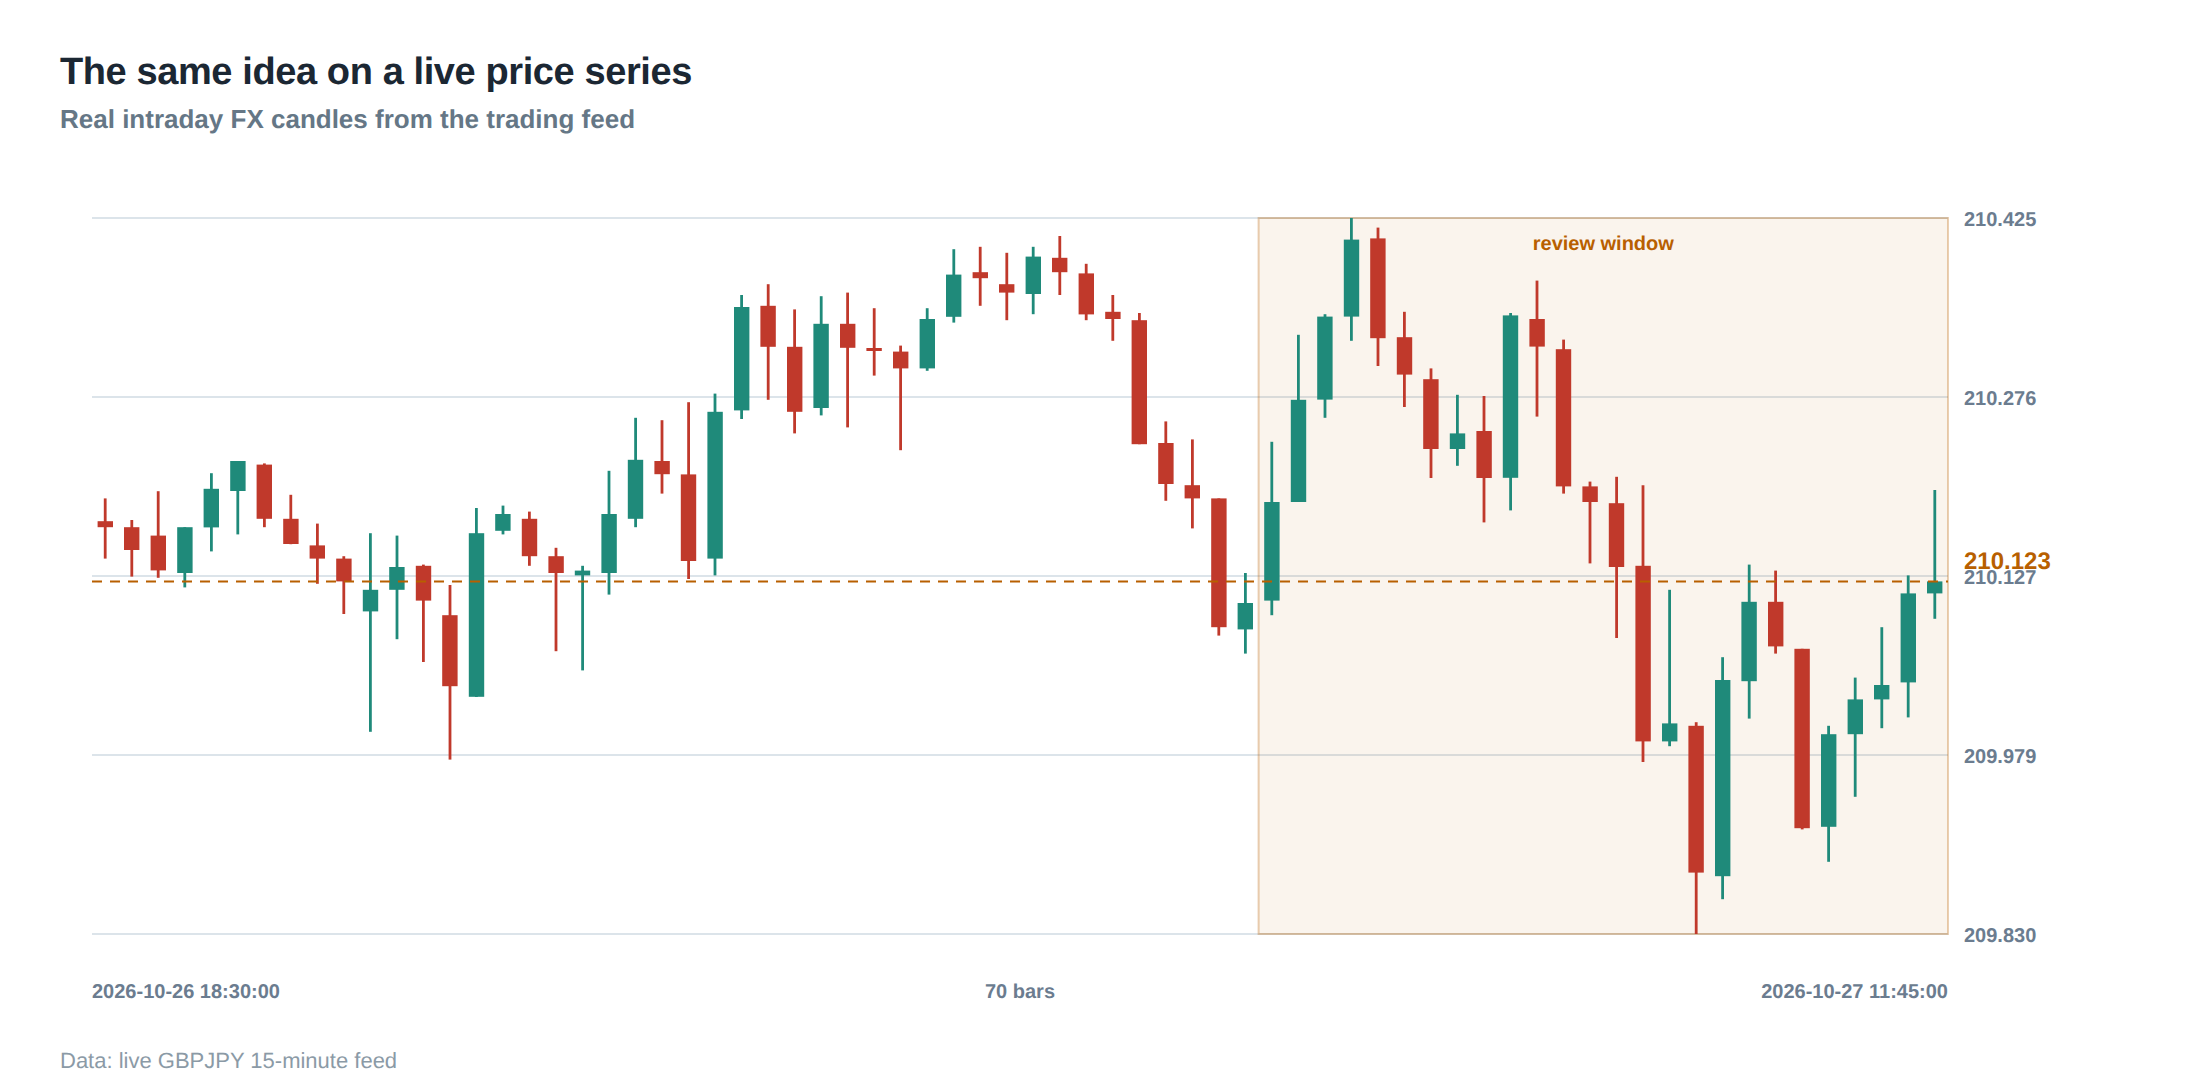
Even a well‑designed kill‑switch architecture can fail when the market environment pushes the system beyond its assumptions. One common failure mode is the “orphan order” – an order that has been sent to an exchange but whose acknowledgement never reaches the local order‑book due to a network partition. The strategy controller believes the order has been cancelled, yet the exchange still holds it in the queue. If the market gaps, that orphan can be filled at an unexpected price, creating a hidden exposure that the firm‑level controller cannot see.
Another break point is the latency between the moment a stop request is generated and the moment the firm‑level controller disables the submission path. In ultra‑low‑latency venues, a few microseconds can be enough for a burst of orders to slip through, especially if the submission gateway is multi‑threaded and does not serialise the stop flag across all worker threads.
A third weakness is the reliance on a single source of authority for the stop request. If the watchdog process itself crashes or is compromised, the downstream controllers never receive a valid request. In practice, firms have observed that a corrupted configuration file can prevent the account controller from recognising the stop flag, leaving the strategy to continue operating under the false belief that it is in a safe state.
Finally, the human element can introduce delay. In many desks the final acknowledgement is required from a senior trader before the firm‑level controller will fully lock down the infrastructure. During a market‑wide flash crash, the time taken for a phone call to be answered can be the difference between a controlled unwind and a cascade of forced liquidations.
The operating path, stage by stage
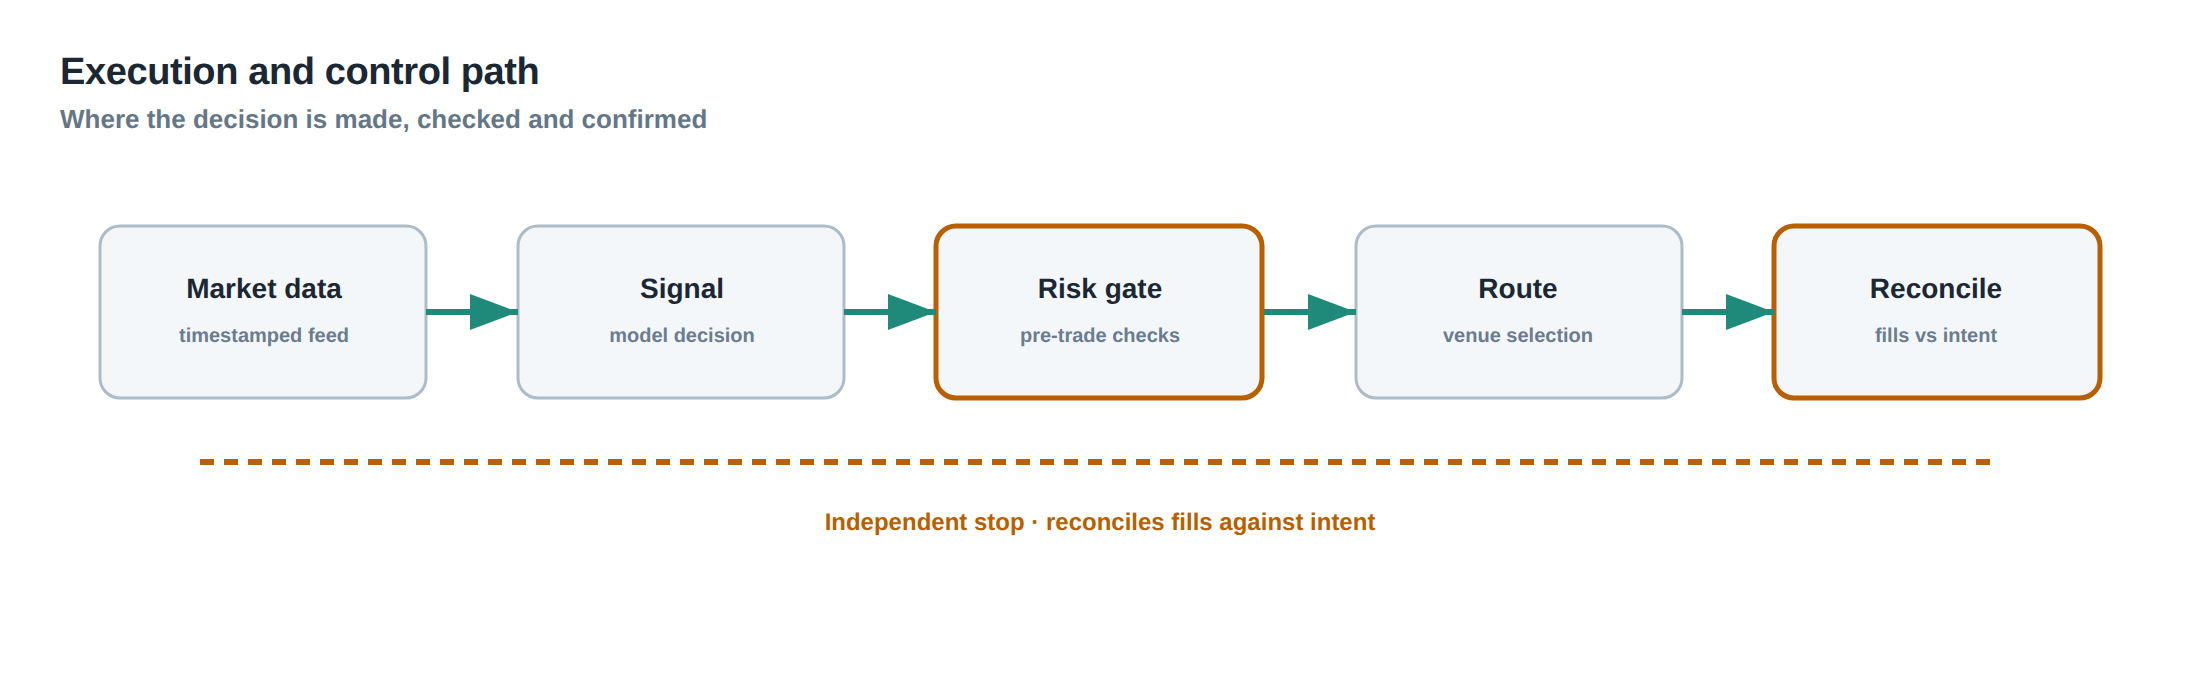
The operating path begins with continuous monitoring. Each component – market‑data feed, order‑gateway, risk engine – publishes heartbeat metrics to a central observability bus. A dedicated watchdog service subscribes to these metrics and applies threshold rules. When a rule is breached, the watchdog emits a “STOP” event that includes a unique correlation identifier, the timestamp, and the reason code.
Stage one is the propagation of the STOP event to the three controllers. The event is transmitted over a reliable, ordered messaging protocol (for example, a replicated Kafka topic with exactly‑once semantics) to guarantee that each controller receives the same snapshot of the request.
Stage two is the local decision logic. The strategy controller parses the event, retrieves the current order‑book snapshot from its in‑memory cache, and runs the cancel‑or‑flatten rule‑set for each open order. The account controller aggregates the resulting actions, applies the account‑level exposure limits, and decides whether to augment any action.
Stage three is the firm‑wide enforcement. The firm controller writes the STOP event to a distributed lock service (such as etcd) that gates all outbound order‑submission APIs. The lock service is consulted by every gateway thread before it serialises a new order; if the lock is held, the order is rejected with a “STOPPED” error code.
Stage four is the acknowledgement cascade. Each controller, after completing its action, publishes an “ACK” message that includes the original correlation identifier and a status flag (SUCCESS or FAILURE). The watchdog aggregates the ACKs; only when it has received three SUCCESS messages does it raise the overall status to “STOP COMPLETE.”
Stage five is the post‑mortem logging. All state transitions, order IDs, and position changes are written to an immutable audit log that is later used for forensic analysis and regulatory reporting.
Controls that act before the damage
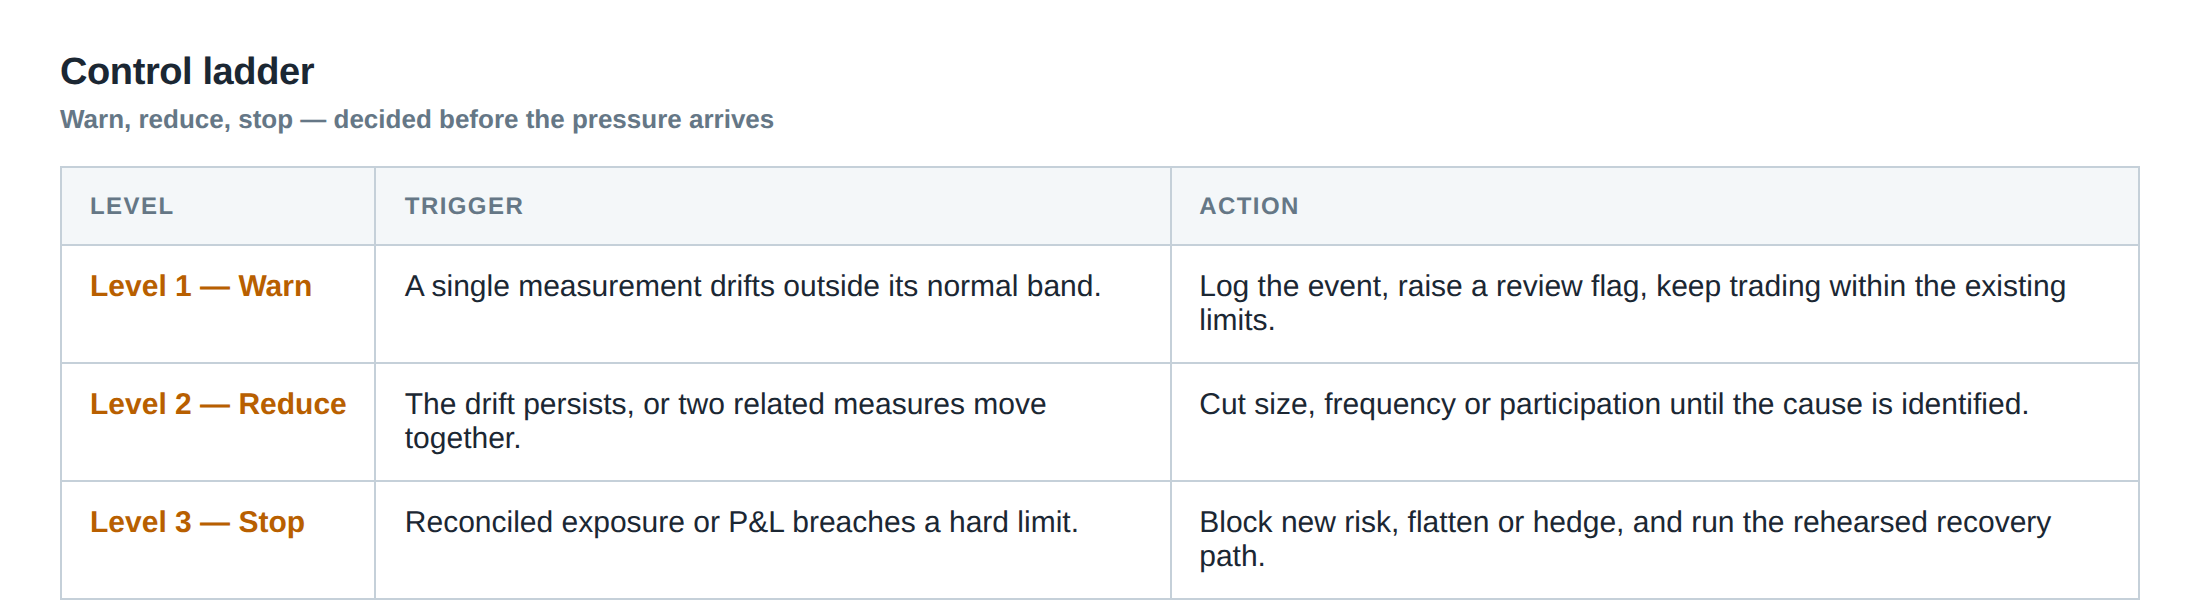
Preventative controls sit upstream of the emergency path and aim to reduce the probability that a stop will ever be needed. The first tier is a “pre‑flight” permission check that validates the identity of any process that attempts to submit orders. This check is performed at the API gateway and is enforced by a token‑based authentication system that can be revoked instantly by the firm‑level controller.
The second tier is an “exposure ceiling” that continuously evaluates the marginal contribution of each new order to the strategy’s risk budget. If the projected delta after the order would exceed the strategy limit, the order is rejected before it leaves the desk. This is effectively a dynamic “stop‑loss” that operates on the order‑generation stage rather than after the order is live.
A third tier is a “heartbeat watchdog” that monitors latency and data integrity. It measures round‑trip times for market‑data packets, checks sequence numbers for gaps, and raises a low‑severity alert if any metric deviates from the baseline. The alert can be configured to automatically tighten the exposure ceiling, thereby reducing the size of subsequent orders while the anomaly persists.
Finally, regular “kill‑switch drills” are essential. During a drill, a simulated STOP event is injected into the production messaging bus, and the entire path – from detection through firm‑wide lock – is exercised end‑to‑end. The drill records the time taken for each stage, verifies that no orphan orders remain, and confirms that the audit log contains a complete record. The results are reviewed by the risk committee and any latency outliers are investigated.
How to measure whether it is working
The primary metric is “time‑to‑safe‑state,” defined as the elapsed time from the instant the watchdog raises a STOP event to the moment the firm‑level controller records a SUCCESS acknowledgement from all three layers. In a well‑tuned environment this should be measured in low‑single‑digit milliseconds for ultra‑low‑latency desks, and in sub‑second for longer‑horizon algorithmic desks.
A secondary metric is “orphan‑order rate,” the proportion of STOP events after which post‑mortem analysis discovers at least one order that remained active on an exchange. This rate should be driven towards zero; any non‑zero value indicates a failure in the acknowledgement or network‑reliability path.
A third indicator is “exposure‑leakage,” calculated as the net position remaining after the STOP event divided by the pre‑STOP exposure. A value above 5 % suggests that the flattening logic is either too conservative or that the hedge leg failed to unwind.
All three metrics are logged to a time‑series database and plotted on a dashboard that shows trends over weeks and months. Deviations from baseline trigger a review of the underlying rule‑sets, the network topology, or the authentication token revocation process.
The portfolio view
From a portfolio perspective the kill‑switch is not an isolated safety valve but a component of the overall risk‑management architecture. Each strategy contributes to the portfolio’s aggregate greeks, and the portfolio‑level risk limits are enforced by the account controller. When a STOP event is raised, the portfolio manager must understand how the forced flattening of one strategy will affect the net exposure of the others.
If the portfolio is delta‑neutral, a forced flatten of a market‑making leg may leave a residual delta that must be absorbed by a separate statistical arbitrage strategy. The portfolio manager therefore needs a “re‑balancing buffer” – a pre‑allocated amount of capital that can be deployed instantly to offset the shock.
Moreover, the portfolio’s performance attribution must capture the cost of emergency actions. The realised P&L from the forced flatten, the transaction costs incurred, and the opportunity cost of lost spread capture are all recorded as “kill‑switch expense” and reported alongside normal trading costs. Over time this expense can be benchmarked against the avoided loss that would have occurred without the emergency stop, providing a quantitative justification for the system’s existence.
In practice the portfolio view also dictates the hierarchy of stops. A firm‑wide stop will always trump a strategy stop, which in turn will trump an account stop. The hierarchy ensures that a systemic market event – for example a sudden exchange suspension – can be halted at the highest level, preventing lower‑level controllers from inadvertently re‑opening risk channels.
—
Is your desk’s current emergency‑control architecture capable of guaranteeing that no stray orders or hidden positions survive a sudden market disruption?
About the research behind this lesson
The seminar frames electronic markets as price-time-priority queues. It separates queue value into spread capture versus adverse-selection cost and the option value of retaining a place in line.
Applied to this lesson: An order lifetime therefore cannot be based on elapsed time alone: the system must reassess whether its queue position, expected spread and adverse-selection risk still justify keeping the order alive.
Two live systems, one desk
PULSE-X — power-packed HFT: high-frequency momentum on XAUUSD and EURUSD. System details · Live account
NIC-X — ultra-low drawdown: displaced-print arbitrage for large capital. System details · Live account
Start now: leave your email and request a free trial — we will send the pricing, the connection route and the trial terms. Pricing
Live chat and updates: Telegram @xtrskhft
Source: High-Frequency Trading and Modern Market Microstructure
Educational content only. Trading leveraged products involves risk.
Chat with XTRSK
Chat ready
Start a chat and the XTRSK team will be notified immediately.