XCore HFT / Trading Lab
A kill switch is a system, not a button
Quantitative execution, market-microstructure, and risk-control research from XTRSK.
What this problem really is
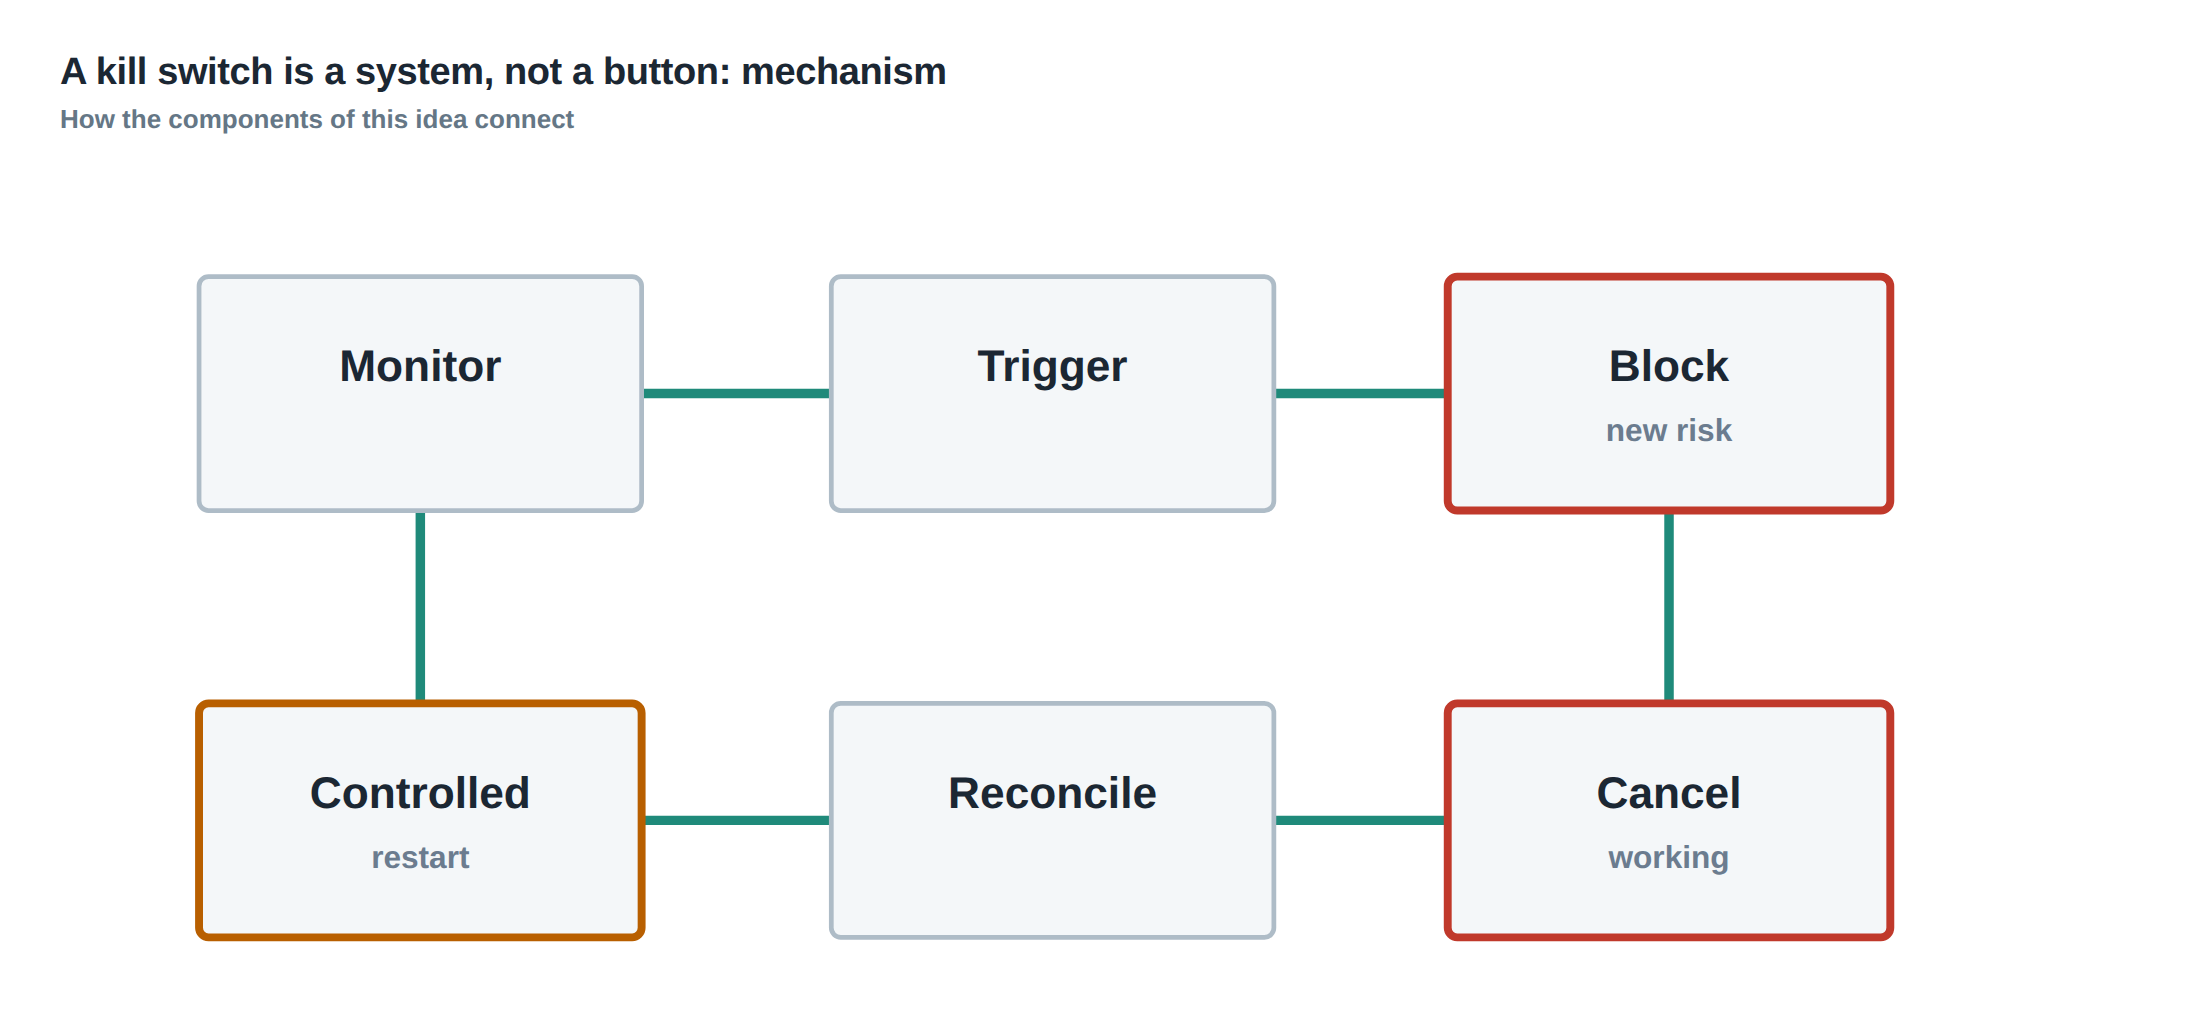
In electronic trading the line between a functioning algorithm and a runaway liability can be vanishingly thin. A “kill switch” is often imagined as a single button that, when pressed, halts a process. In practice the problem is far more complex: the system must simultaneously stop the generation of new risk, unwind or neutralise any working orders, and expose the residual exposure that remains on the books. If any of those three functions fails, the so‑called kill switch becomes a false sense of security and the desk can be left with open positions that continue to accrue market risk while the operators scramble to understand what is still live. The difficulty is compounded by the layered nature of modern prop‑trading infrastructure – a single strategy runs inside a container, which sits inside an account, which in turn is governed by firm‑wide risk limits. Each layer may have its own stop‑logic, and each must be able to act independently if the others become unavailable. The real problem, therefore, is not a missing button but the absence of a coherent, multi‑tiered emergency control that can be invoked from outside any failed component, that knows exactly what to do with every order, and that reports back the state of the portfolio in a deterministic way.
How the mechanism works, step by step
The first step is to classify the stop request. A strategy stop is raised when the algorithm detects an internal fault – for example, a divergence between model‑predicted and realised price impact that exceeds a calibrated threshold. An account stop is triggered when the aggregate exposure of all strategies linked to a particular capital allocation breaches a pre‑set limit, such as a 5 % VaR breach over a 10‑minute horizon. A firm‑wide stop is a top‑level safeguard, typically activated by senior risk officers when market conditions deteriorate beyond a systemic threshold, for instance a sudden widening of the bid‑ask spread across multiple venues.
Once the stop type is identified, the system determines the required action. “Cancel” means to send cancellation messages for all resting orders that have not yet executed; “flatten” instructs the execution engine to generate market orders that close any filled positions; “both” combines the two, ensuring that no new exposure can be created and that any existing exposure is actively reduced. The decision is encoded in a stop‑policy table that each layer consults before acting.
The next stage is to route the stop command outside the failed application. The control must be reachable via a dedicated, authenticated API that lives on a separate network segment, often behind a hardware firewall, so that a crash of the trading stack does not also take the kill switch offline. The command is logged with a unique identifier, timestamped, and signed with a cryptographic key that only authorised risk managers possess.
Finally, the system acknowledges the request, reports the actions taken, and enters a recovery mode. Acknowledgement is not merely a “yes” – it includes a concise state dump that lists the number of orders cancelled, the notional value of positions flattened, and any residual exposure that could not be addressed automatically (for example, an unmatched hedge leg awaiting a counter‑trade). This dump is the basis for the post‑mortem and for any manual intervention that may be required.
A worked example with real numbers
Consider a market‑making strategy that maintains a 10‑tick wide quote on a futures contract, posting 5 000 contracts on the bid and 5 000 on the ask at each price level. The algorithm runs on a container that receives market data at 1 ms latency. At 09:30:12.345 the system detects that the realised spread has collapsed from 8 ticks to 2 ticks while the order‑book depth on the exchange has thinned dramatically. The internal risk model flags a 150 % increase in adverse‑selection cost, exceeding the pre‑set 120 % trigger for a strategy stop.
The stop command is issued with the “both” action. The controller first sends cancellation messages for the 10 000 resting orders. Because the exchange processes cancellations at roughly 0.8 ms per message, the last cancel is acknowledged at 09:30:12.853. Meanwhile, the algorithm has already filled 1 200 contracts on the bid side at 2 ticks better than the mid‑price, creating a net long exposure of 1 200 contracts. The flatten component immediately generates market‑able orders to sell the 1 200 contracts. Execution latency on the primary venue is 1.2 ms, so the flattening trade completes at 09:30:13.057, leaving a residual long exposure of 300 contracts that were matched on a secondary venue where latency is higher (2.5 ms).
The acknowledgement packet returned to risk management records: “Strategy stop – 10 000 cancels sent, 9 980 confirmed; flatten executed – 1 200 contracts sold, 300 contracts remain open on Venue B.” The residual exposure is then displayed on the firm‑wide dashboard, prompting the senior risk officer to decide whether to issue an account‑level stop for the entire account, which would in turn send a firm‑wide “cancel all” to every strategy linked to that capital pool. The example illustrates that stopping the process alone would have left the 300 contracts live, exposing the desk to a price move that could have been catastrophic if the market continued to move against the position.
Where it breaks in live markets
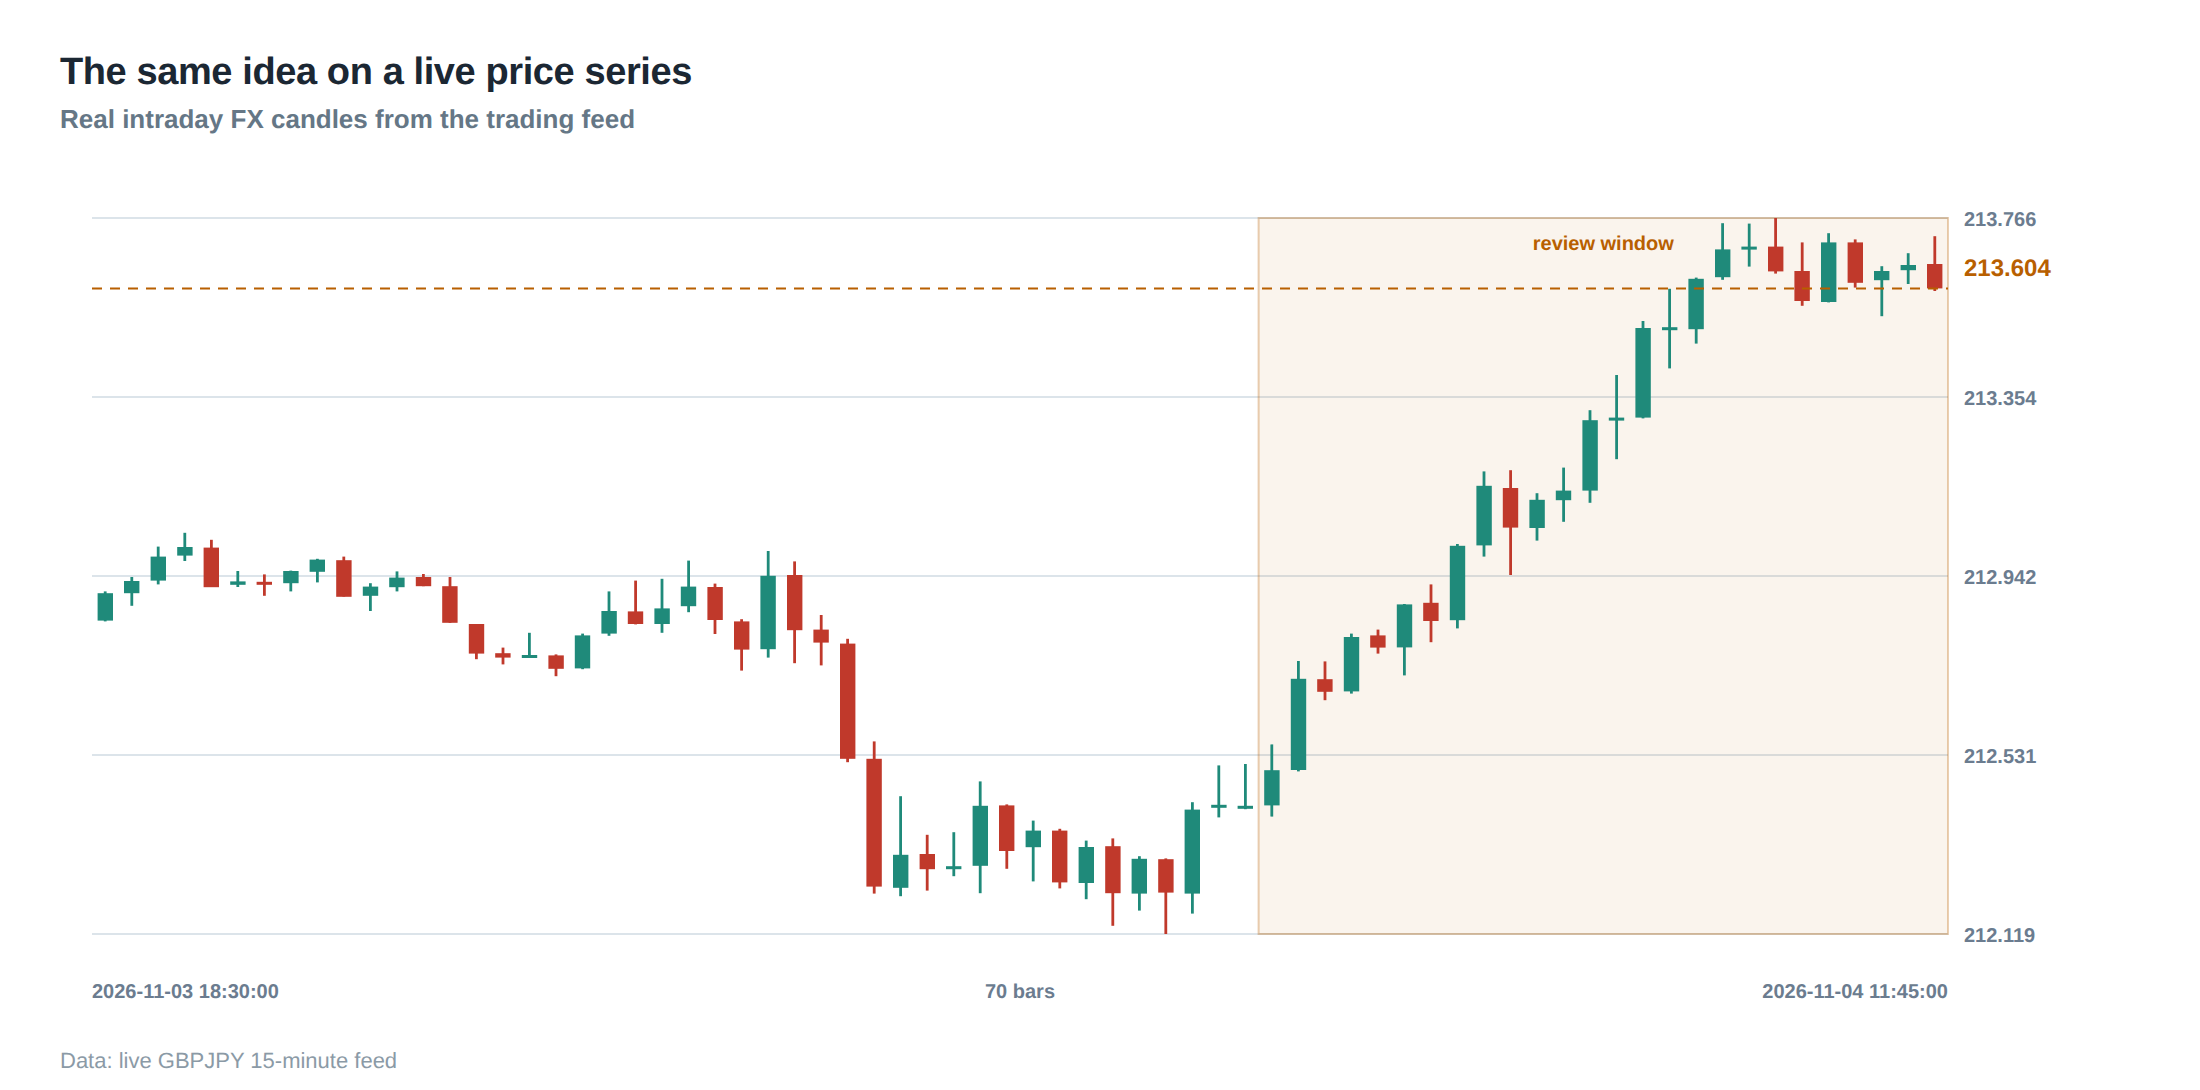
In production environments the kill‑switch logic often fails at the interface between the execution gateway and the exchange. Exchanges may reject mass cancellations if they exceed a per‑second rate limit, or they may silently drop cancellation messages during a surge in traffic, leaving orders in the market despite the desk’s belief that they are gone. Similarly, flattening orders can be throttled by the venue’s order‑rate caps, causing a partial fill that leaves a non‑trivial residual position.
Another common failure point is the dependency on the same process that is being stopped. If the stop request is sent through the same messaging bus that the algorithm uses for order placement, a crash in the algorithm can also corrupt the bus, meaning the stop never reaches the gateway. In such cases the desk is left with a “zombie” order book that continues to react to market data, potentially generating fills that the risk engine cannot attribute.
Finally, human factors introduce fragility. Permissions are sometimes granted too broadly, allowing junior traders to invoke a firm‑wide stop, which can be abused or triggered inadvertently. Conversely, overly restrictive permissions can prevent the right person from acting quickly, leading to a delayed response that magnifies losses. Without a clear, auditable path for acknowledgement and recovery, the post‑incident analysis becomes a guessing game, and the desk may repeat the same mistake.
The operating path, stage by stage
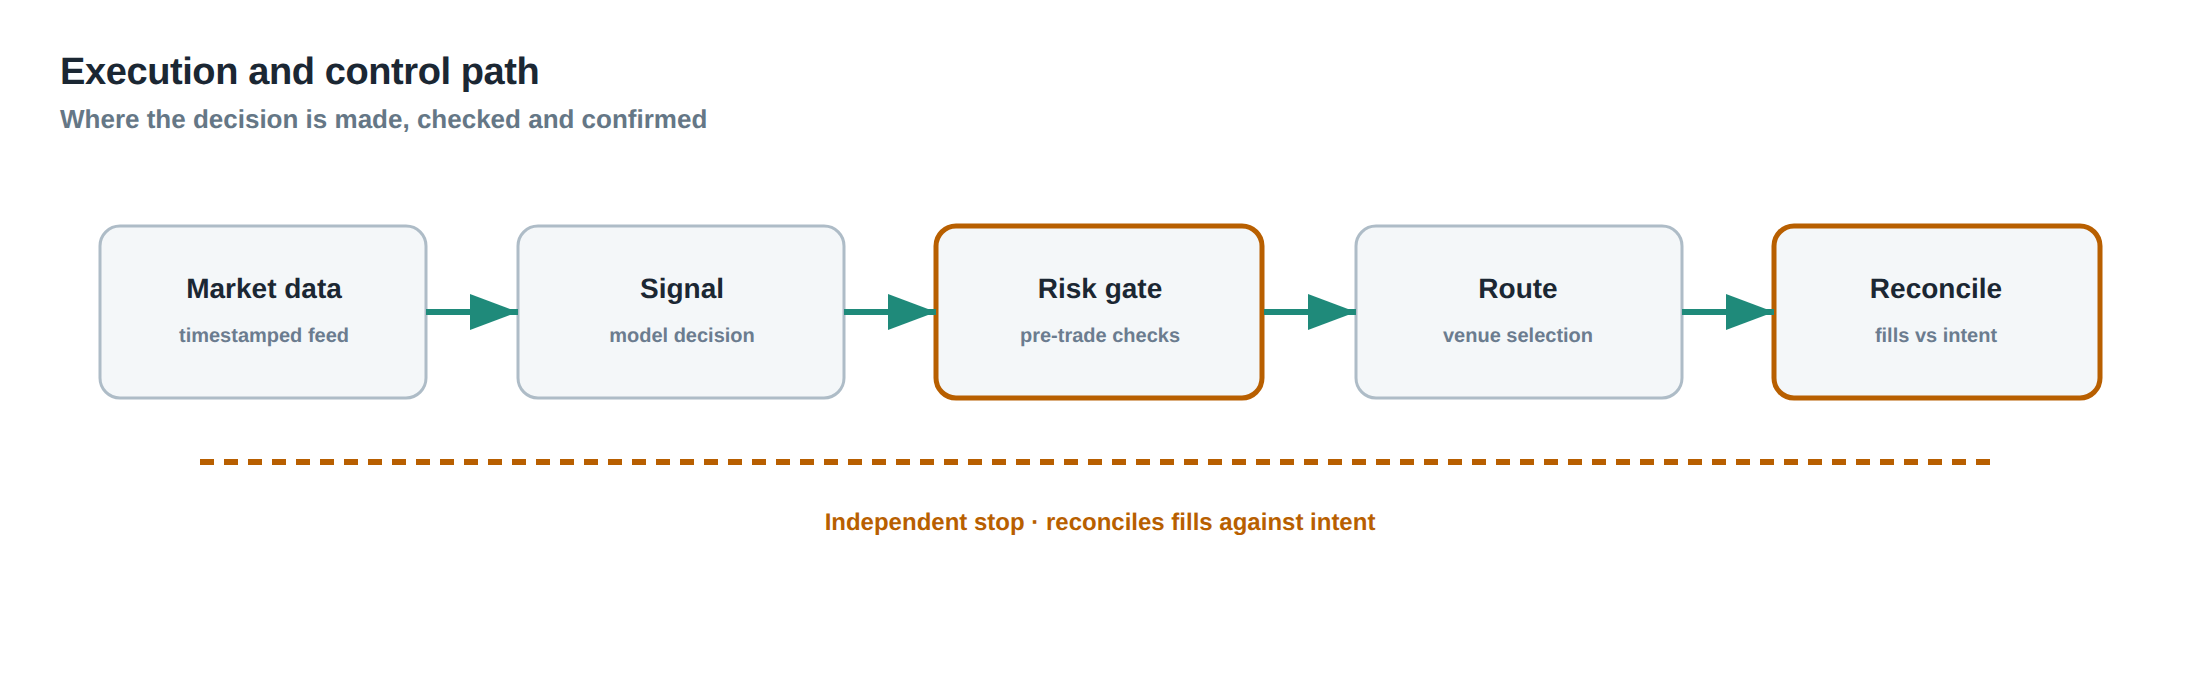
The emergency control path begins with detection. Sensors embedded in the strategy code monitor a set of risk metrics – for example, realised spread, order‑book depth, and VaR drift – and raise a flag when any metric crosses its threshold. The flag is propagated to a dedicated risk‑control service that resides on a separate host, ensuring that a crash in the strategy container cannot impede the escalation.
The second stage is classification. The risk‑control service evaluates the flag against the stop‑policy table and decides whether a strategy, account, or firm‑wide stop is appropriate. It also selects the required action – cancel, flatten, or both – based on the current state of the order book, as reported by the order‑management system (OMS).
In the third stage the service sends a signed stop command over a hardened API to the execution gateway. The gateway, which sits between the OMS and the exchanges, parses the command and initiates the appropriate sub‑routines: a bulk‑cancel engine that respects venue‑specific rate limits, and a flatten engine that constructs market‑able orders sized to the current position.
The fourth stage is confirmation. Each venue returns an acknowledgement for each cancellation or execution. The gateway aggregates these acknowledgements, reconciles them with the OMS state, and produces a concise report that is streamed back to the risk‑control service.
The final stage is recovery. The risk‑control service logs the full report, updates the desk‑wide exposure view, and, if necessary, raises a manual intervention ticket that includes the residual exposure, the venues affected, and the timestamped actions taken. This ticket becomes the entry point for the post‑mortem analysis and for any corrective actions such as adjusting the stop‑policy thresholds.
Controls that act before the damage
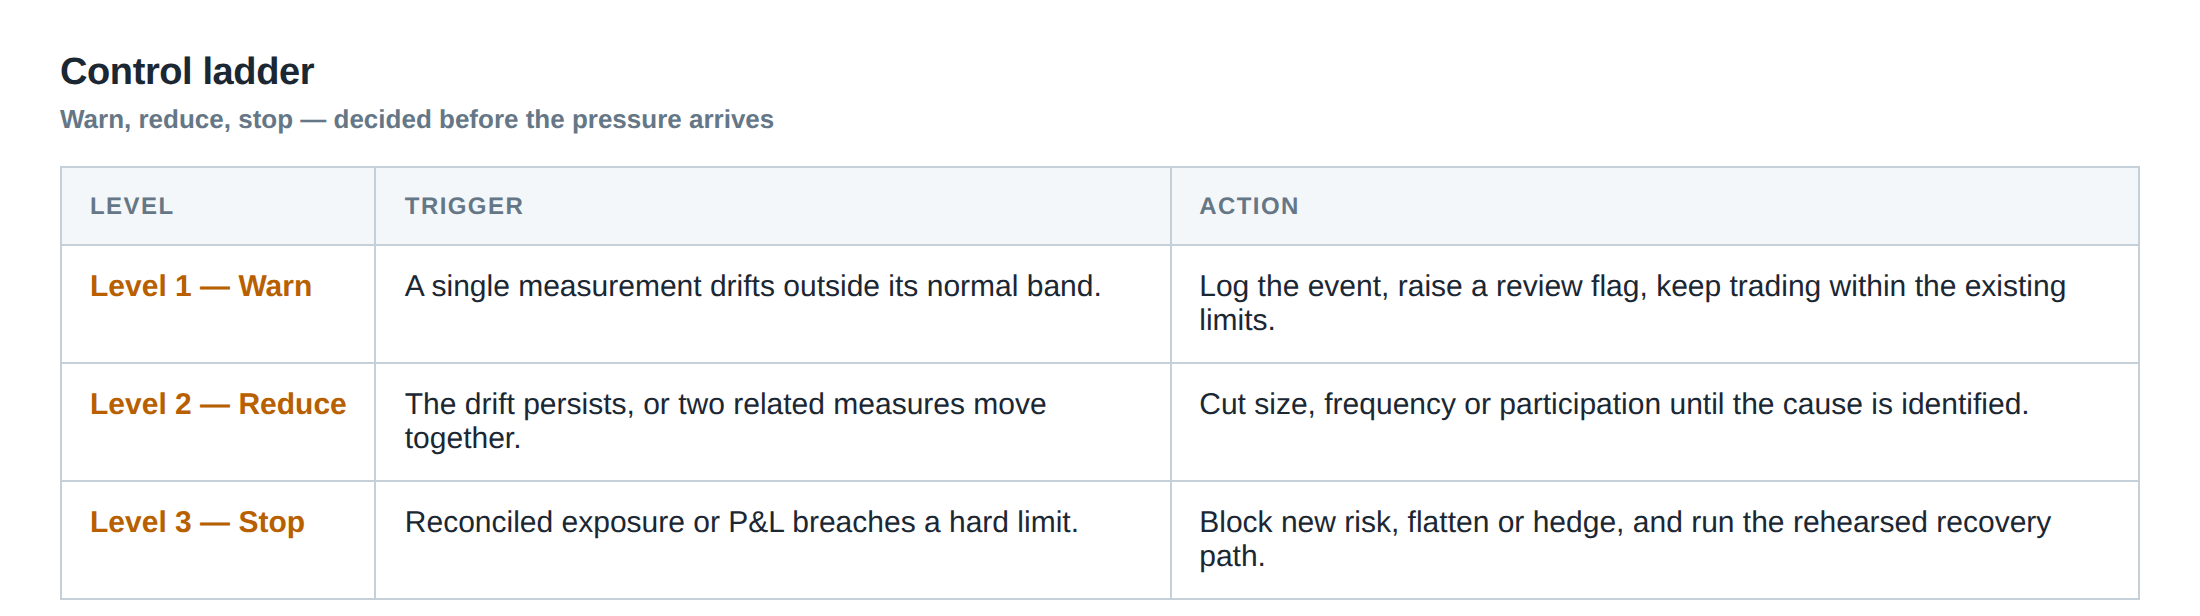
Preventative controls are the first line of defence. A ladder of safeguards should be erected, beginning with the most granular – the strategy stop – and climbing to the firm‑wide emergency brake. Each rung of the ladder must be independently testable and must have a clearly defined scope.
At the strategy level, the code should embed a “pre‑flight” check that validates the health of the market‑data feed, the connectivity to the OMS, and the latency of the order‑submission path. If any of these checks fail, the strategy should automatically transition to a “paused” state, refusing to send new orders while still allowing the risk engine to monitor existing exposure.
At the account level, a real‑time aggregation of all strategy exposures should be compared against a dynamic VaR surface that incorporates recent volatility spikes. When the aggregate exposure approaches the limit, the system should pre‑emptively reduce order sizes or tighten quote widths, thereby avoiding the need for an abrupt stop.
At the firm level, a market‑wide stress monitor watches macro variables such as the S&P 500 volatility index, cross‑asset liquidity metrics, and exchange‑wide order‑book imbalances. When a systemic signal crosses a high‑confidence threshold, the firm‑wide stop can be triggered automatically, bypassing the need for human approval in an emergency.
All of these controls must be reachable via the same out‑of‑band API used for emergency stops, ensuring that even if the primary trading stack is compromised, the protective ladder remains operable. Regular permission audits, multi‑factor authentication for stop invocation, and a clear chain of acknowledgement – where each layer signs off on the action it has taken – are essential to prevent accidental or malicious misuse.
How to measure whether it is working
Measurement begins with latency tracking. The time from flag generation to receipt of the first cancellation acknowledgement must be recorded for each venue, and the distribution of these latencies should be compared against a pre‑defined Service Level Agreement (SLA), for example 95 % of cancels acknowledged within 1 ms.
Next, completeness is assessed by reconciling the OMS state with the exchange state after a stop. Any discrepancy – such as an order that remains live on an exchange while the OMS records it as cancelled – is a failure that must be logged and investigated. The residual exposure metric, expressed as the notional value of positions that remain after the flatten step, provides a quantitative gauge of how effective the flatten component was.
A third metric is the “stop‑success rate”, the proportion of stop requests that result in the intended action (cancel, flatten, or both) without manual intervention. This rate should be tracked over time, with a target of at least 99 % for strategy stops and 98 % for firm‑wide stops, reflecting the higher complexity of the latter.
Finally, drill performance is measured by the time taken to complete a simulated stop from detection to full acknowledgement, and by the number of procedural errors observed (for example, an operator entering the wrong stop level). Regular drill reports feed back into the risk‑policy review, tightening thresholds or adjusting the stop‑policy table where gaps are identified.
The portfolio view
From the portfolio perspective, a kill switch is not an isolated tool but a lens through which the overall risk posture becomes visible. When a stop is invoked, the aggregated exposure report collapses the multi‑dimensional risk surface – market, credit, and liquidity – into a single snapshot that shows, for each asset class, the net position, the remaining open orders, and the expected slippage if those orders were to be executed immediately.
Because the stop mechanism distinguishes between “cancel” and “flatten”, the portfolio view can separate passive exposure (orders that have not yet filled) from active exposure (filled positions). This separation is crucial for deciding whether to re‑enter the market after the incident. If the residual exposure is purely passive, the desk may simply let the orders expire; if it is active, the risk manager must assess whether the flattening trades have left the portfolio in a balanced state or whether a manual hedge is required.
Moreover, the portfolio view integrates the firm‑wide stop state, allowing senior managers to see at a glance which accounts have been halted, which strategies are still live, and where the remaining risk resides. This holistic visibility enables a coordinated response, such as reallocating capital from a halted account to a less‑affected one, or adjusting the firm‑wide risk limits in real time.
In practice, the portfolio view is rendered on a dashboard that updates on sub‑second intervals, pulling data from the OMS, the execution gateway, and the risk‑control service. The dashboard highlights any residual exposure exceeding a configurable tolerance, flags venues where cancellations were throttled, and presents a concise log of the stop actions taken. By providing this integrated picture, the kill‑switch architecture transforms an emergency response from a reactive scramble into a measured, data‑driven operation.
Do you have a clear, auditable path that can both halt new risk and reveal any hidden exposure before a market move can turn a stop into a loss?
About the research behind this lesson
The seminar frames electronic markets as price-time-priority queues. It separates queue value into spread capture versus adverse-selection cost and the option value of retaining a place in line.
Applied to this lesson: An order lifetime therefore cannot be based on elapsed time alone: the system must reassess whether its queue position, expected spread and adverse-selection risk still justify keeping the order alive.
Two live systems, one desk
PULSE-X — power-packed HFT: high-frequency momentum on XAUUSD and EURUSD. System details · Live account
NIC-X — ultra-low drawdown: displaced-print arbitrage for large capital. System details · Live account
Start now: leave your email and request a free trial — we will send the pricing, the connection route and the trial terms. Pricing
Join the market discussion: Telegram @squawklive
Source: High-Frequency Trading and Modern Market Microstructure
Educational content only. Trading leveraged products involves risk.
Chat with XTRSK
Chat ready
Start a chat and the XTRSK team will be notified immediately.