XCore HFT / Trading Lab
Lot size translates a stop into money
Quantitative execution, market-microstructure, and risk-control research from XTRSK.
What this problem really is
Traders rarely lose money to the concept itself; they lose it to the gap between the concept and the plumbing that implements it. The distance to a stop does not determine account risk until it is combined with position size and instrument value.
Lot size translates a stop into money. is easy to describe and harder to operate, and the gap between the description and the operation is where trading risk accumulates. The mechanism is a sequence, not a single decision. Each stage consumes the output of the previous one, and a small error early in the chain is amplified by everything that follows.
The mechanism should degrade predictably: when a dependency slows or disappears, the system should narrow its behaviour rather than invent a new one.
The mechanism is a sequence, not a single decision. Each stage consumes the output of the previous one, and a small error early in the chain is amplified by everything that follows.
Read the idea as a pipeline: observation, interpretation, permission, execution and reconciliation. The desk is only as strong as the weakest of those links on the day it matters.
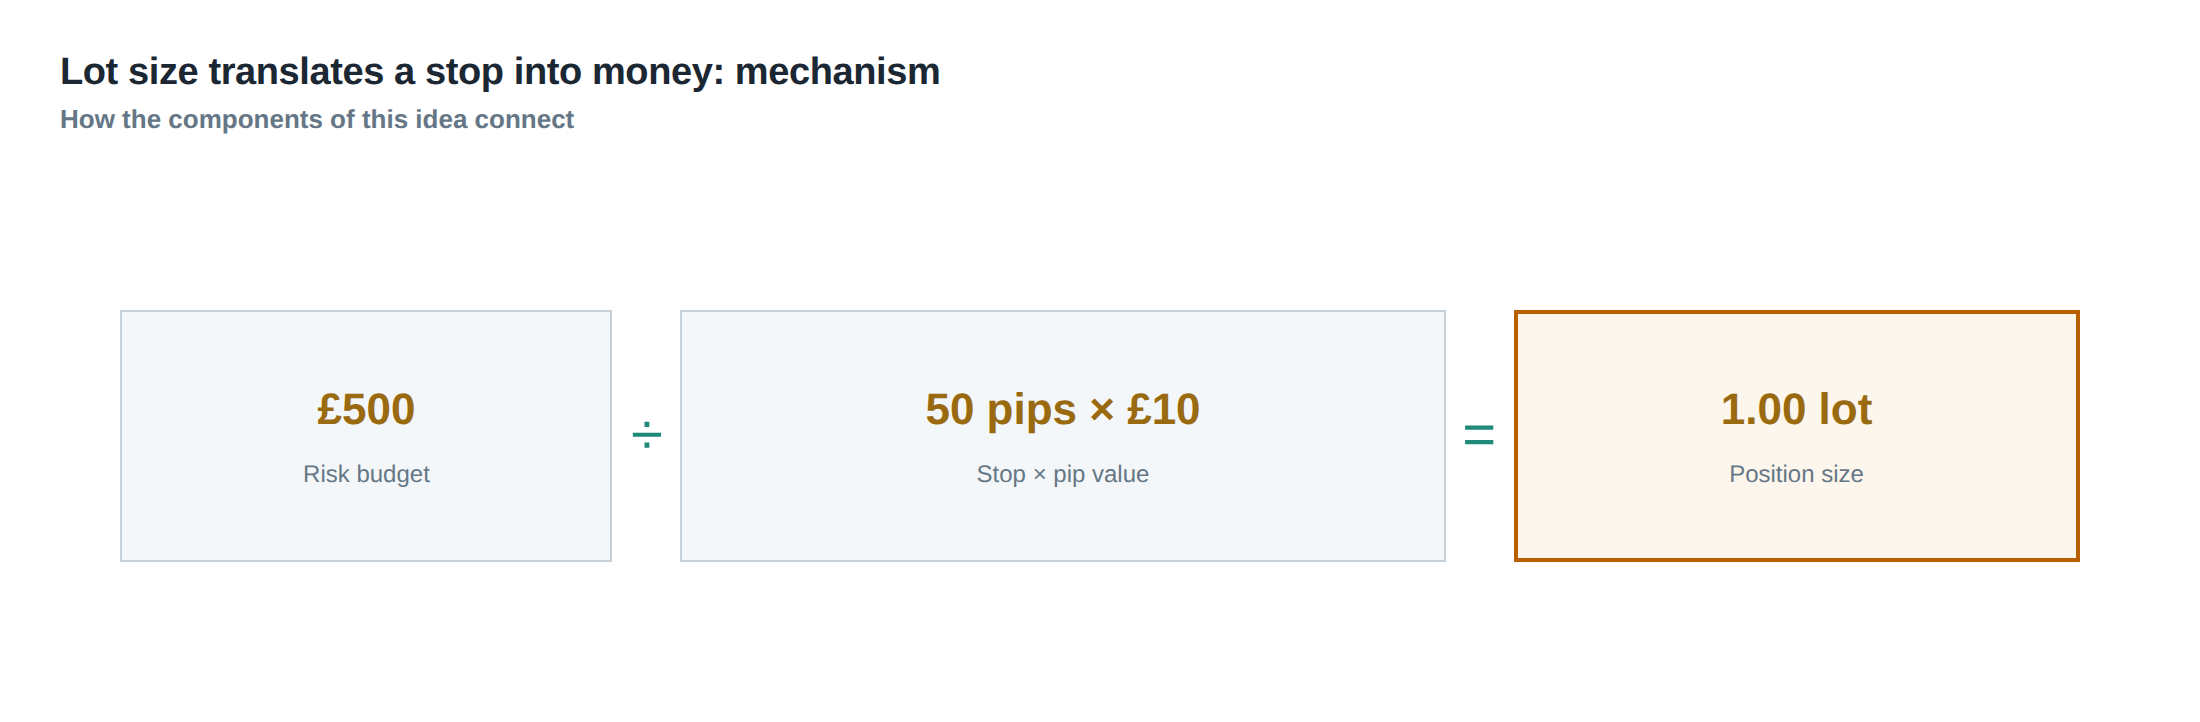
How the mechanism works, step by step
1) Start with an account risk budget. 2) Convert price distance through contract size, tick value and currency. 3) Round down to the venue lot increment. 4) Include spread and expected slippage. 5) Recalculate when the stop or volatility changes.
The mechanism is only as reliable as its least observable stage, so measurement effort should follow the weakest link rather than the most interesting one.
A useful test is to ask which single record, if it were lost, would make the result impossible to explain; that record is the one to protect first.
The mechanism should degrade predictably: when a dependency slows or disappears, the system should narrow its behaviour rather than invent a new one.
The first failure mode is silent drift: the measurement that justified the strategy stops matching the conditions that produce it, and nobody is watching the difference between the two.
A worked example with real numbers
With a five-hundred-pound risk budget, a stop twice as wide normally requires roughly half the position size before costs.
A worked number is useful precisely because it can be wrong in public. If the arithmetic does not survive inspection, the strategy will not survive the market.
Keep the units explicit: currency, notional, size and time. Most apparent edge disappears in a unit conversion that nobody checked.
Recompute the example under a stress variant — wider spreads, thinner depth and slower acknowledgements — and see how much of the margin remains.
The point of the example is to locate the break-even assumption. The strategy is a bet that this assumption holds more often than the cost of being wrong.
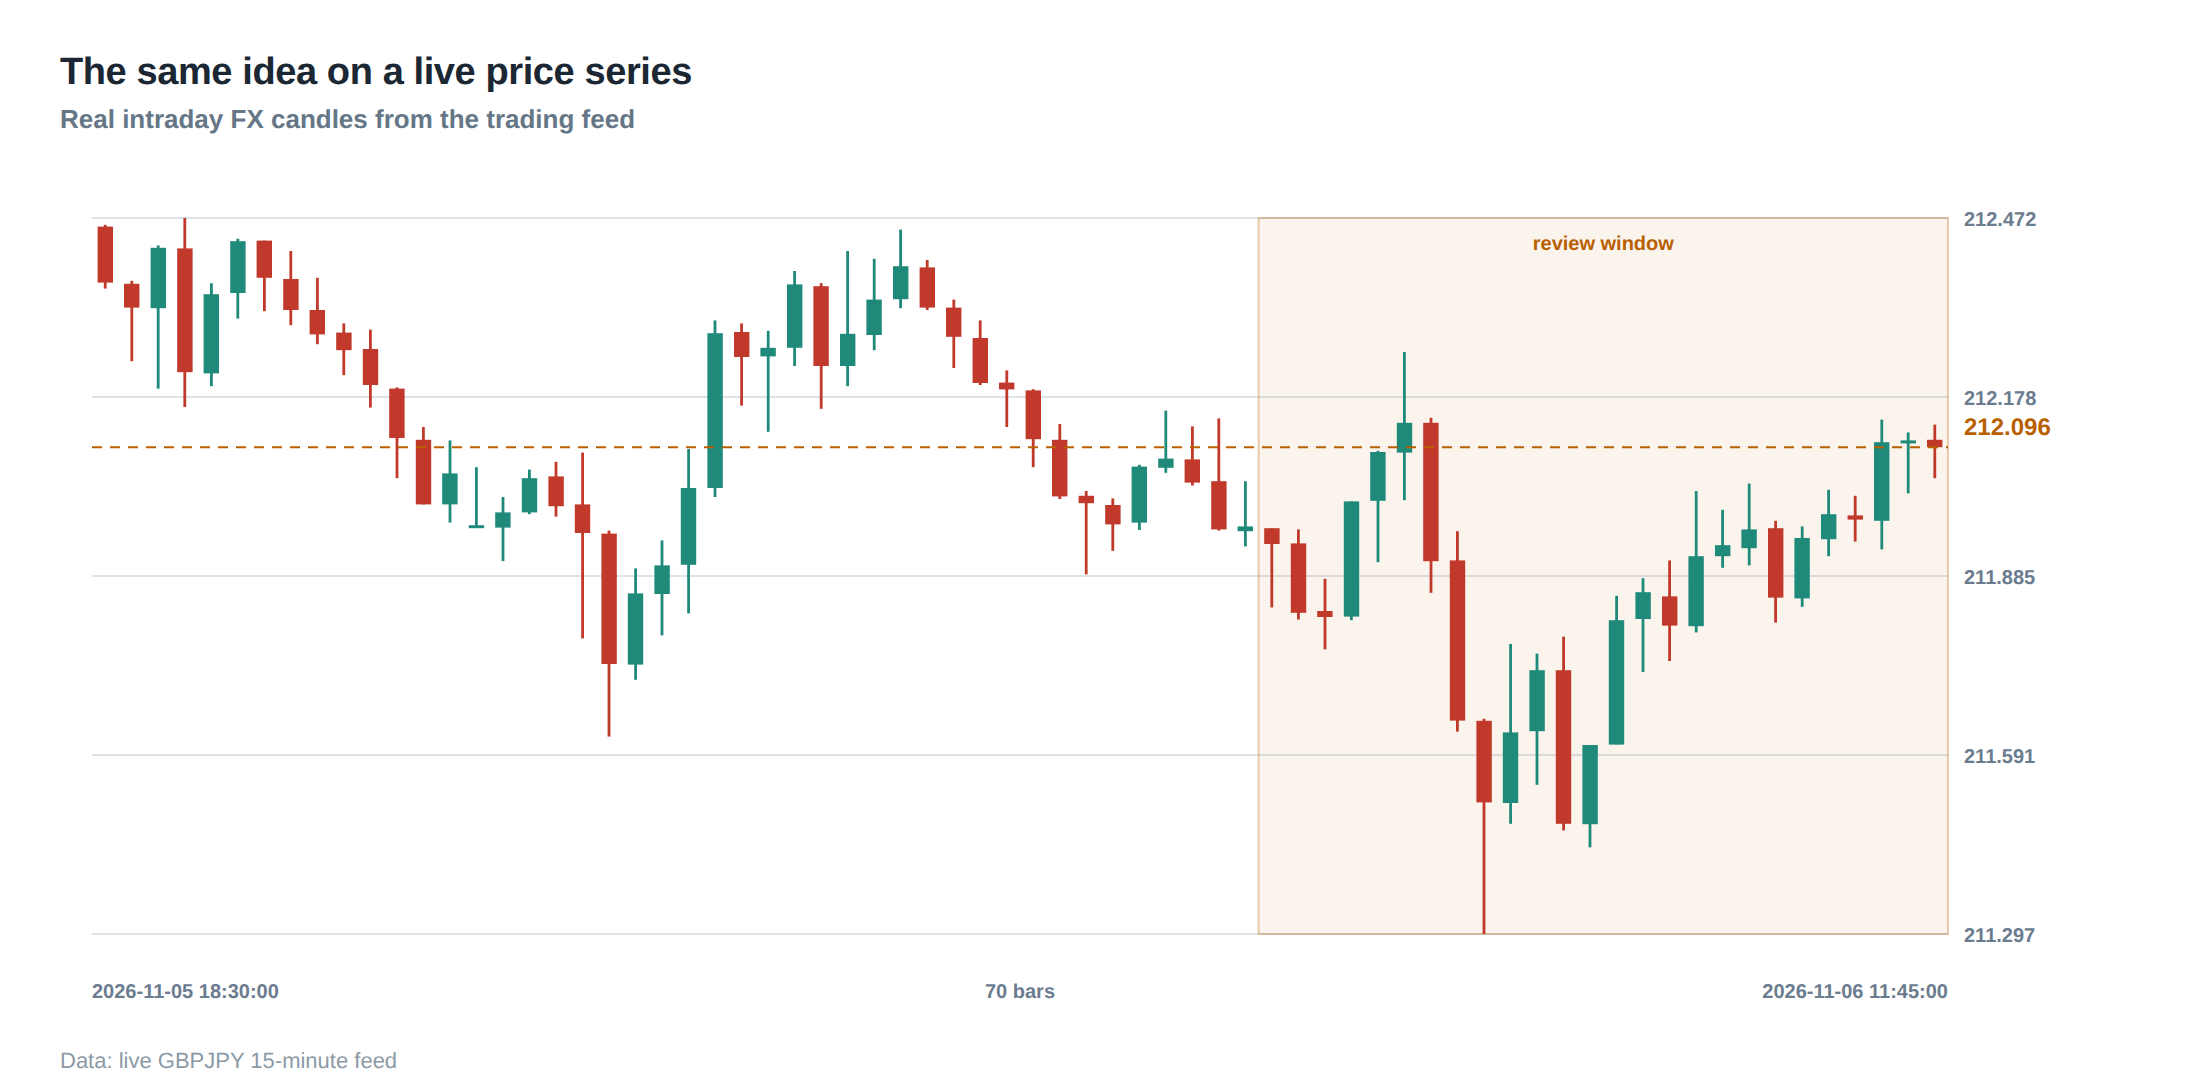
Where it breaks in live markets
The third is concentration. Several positions that look independent share a factor, a venue or a liquidity source, and the book quietly becomes one larger bet than the dashboard suggests.
The fourth is capacity. The same signal that earns a thin edge at small size consumes that edge through market impact as the order grows.
The fifth is the recovery path. A desk that can stop but cannot restart safely has only solved half of the problem it set out to solve.
The first failure mode is silent drift: the measurement that justified the strategy stops matching the conditions that produce it, and nobody is watching the difference between the two.
The second is a control that exists in configuration but not in behaviour. A limit that reads stale or unreconciled state is documentation, not protection.
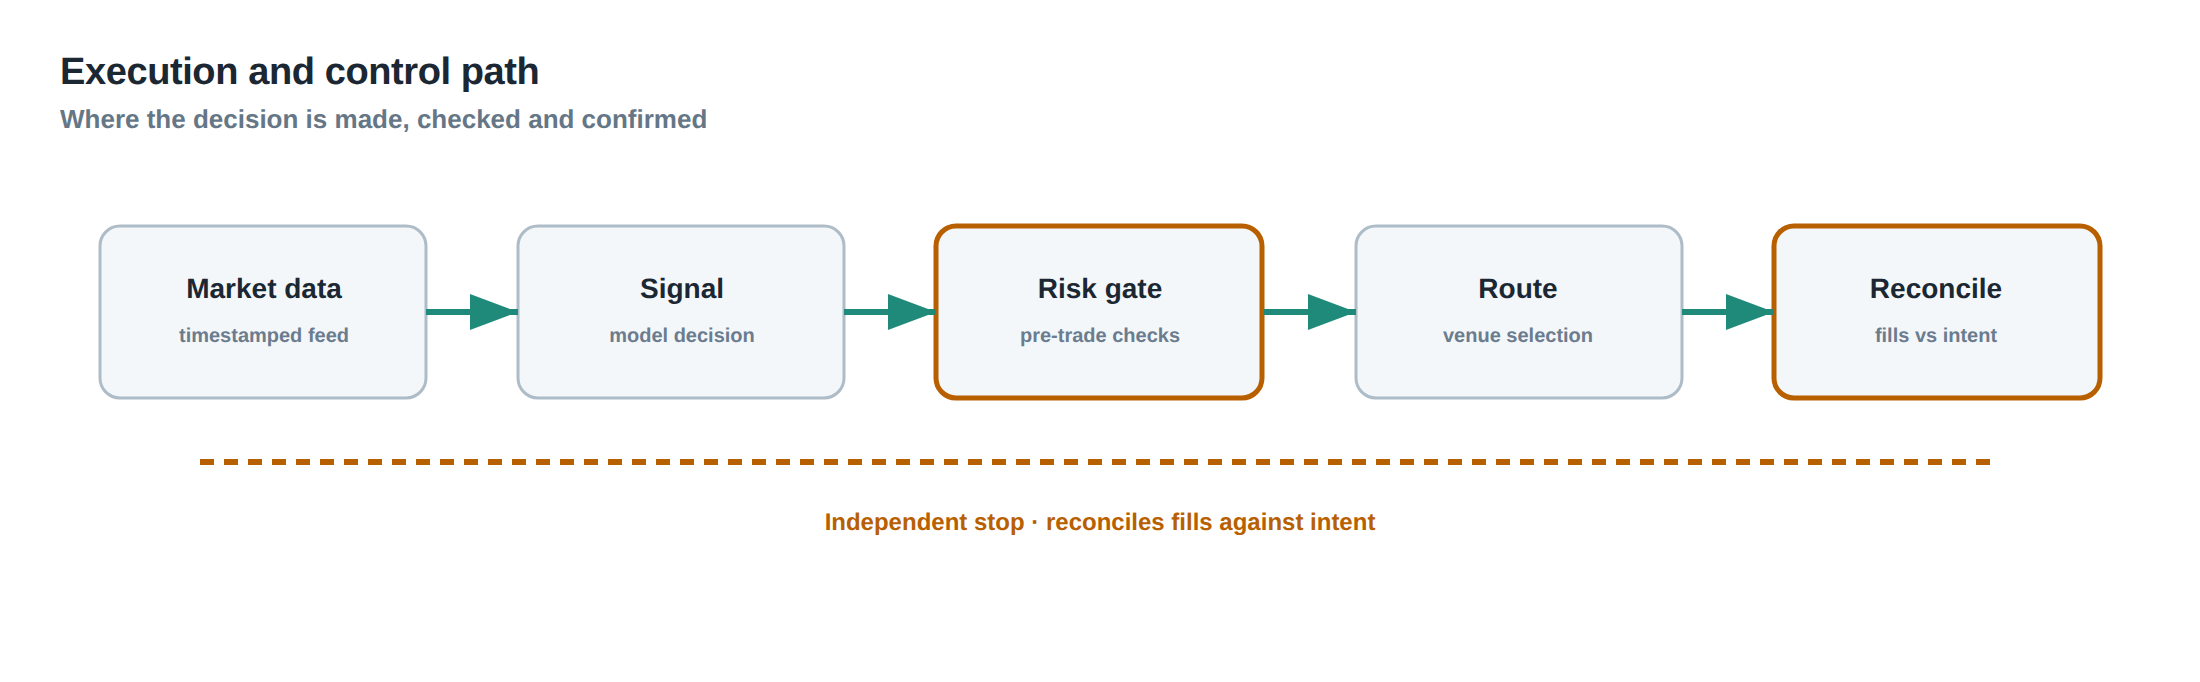
The operating path, stage by stage
A compact checklist is: 1) round down to the venue lot increment; 2) include spread and expected slippage; 3) recalculate when the stop or volatility changes.
The path should be short enough to reason about and instrumented enough to prove. Every extra hop is another place for state to diverge.
Reconciliation closes the loop: the system compares intended exposure with confirmed exposure and refuses to continue on an unexplained gap.
The kill path must be independent of the components it is meant to stop, or it inherits their failure modes at exactly the wrong moment.
Log the decisions the system declined to take, not only the ones it took; rejected opportunities are the cleanest evidence about how the controls behave.
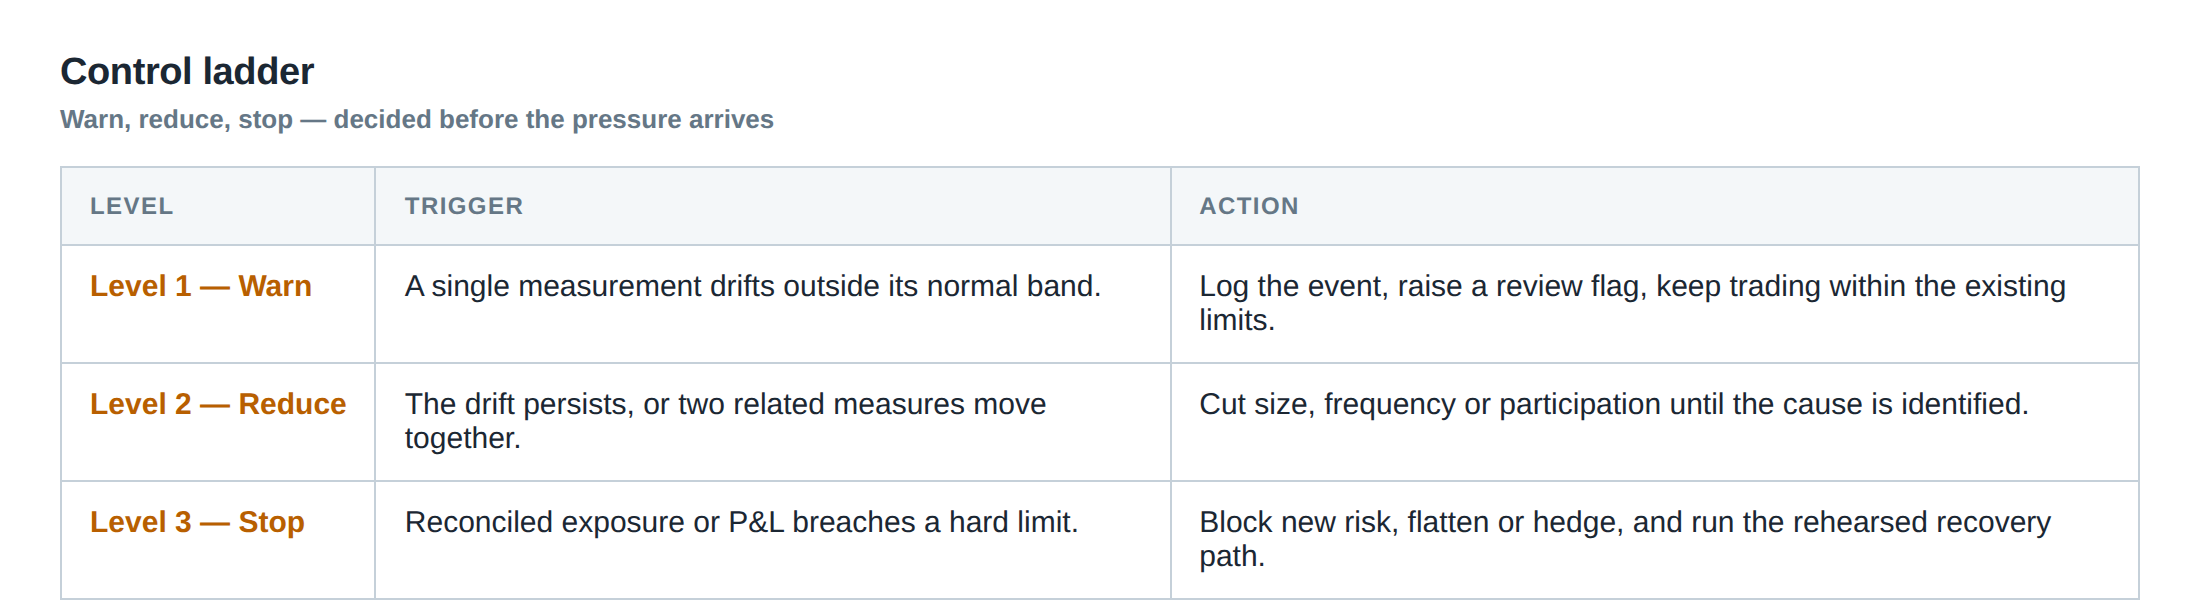
Controls that act before the damage
Use a three-level ladder. Level one warns and records; level two reduces size, frequency or participation; level three blocks new risk and invokes the rehearsed recovery path.
Every limit needs a named owner, an observable trigger and a tested response that does not depend on the component that failed.
Prefer several narrow, well-understood limits over one clever aggregate that nobody can explain under pressure.
A control that fires constantly is a design fault, while a control that never fires has not really been tested.
The sequence matters: warn, then reduce, then stop, with each step leaving a record that the next one can trust.
How to measure whether it is working
Measure the median and the tail separately. An acceptable average can conceal a loss distribution the account could not survive twice.
Record the reason for every rejection and every reduction, not only the outcomes. The audit trail is what lets operations reconstruct a decision without guessing.
Compare decision price, arrival price and realised fill. The gap between intention and execution is the most honest measure of what the system actually delivered.
Track the frequency and duration of abnormal states, not just their existence. A control that fires constantly is a design problem, not a safeguard.
Choose a denominator and keep it fixed. Changing the base between reports makes progress impossible to judge.
Turning the idea into a daily routine
Keep a short list of conditions that would make the desk stand down. A pre-committed exit is worth more than a clever entry.
Feed the review back into the limits. A control that never changes after new evidence is not learning from the market.
Automate the boring part of the review so that attention is free for the ambiguous part, which is the only part that needs a human.
A deep idea earns its keep only when it becomes a routine check that somebody actually runs. Write the check as a question with a numeric answer, not as a principle.
The portfolio view
Ask what happens to the whole book if the shared dependency fails at the worst moment, then size for that day rather than for the average one.
Then widen the lens. A permitted order can still be the wrong portfolio action when several strategies compete for the same capital, venue capacity or hedge.
Individual controls answer whether one instruction is allowed. Portfolio controls answer whether the firm can absorb all allowed instructions at once.
The account experiences combined profit, loss and liquidity demand even when the models are monitored in separate dashboards.
Which assumption here is tested continuously in production, and which one is still trusted from the backtest?
About the research behind this lesson
Andrew Lo's lectures build risk analysis from return distributions and statistical measures, rather than treating one realised result as a complete description of risk.
Applied to this lesson: For a fast strategy, median latency or average fill quality is not enough. The review has to include tail delays, stale-order frequency and the loss distribution when cancellation or routing behaves abnormally.
Two live systems, one desk
PULSE-X — power-packed HFT: high-frequency momentum on XAUUSD and EURUSD. System details · Live account
NIC-X — ultra-low drawdown: displaced-print arbitrage for large capital. System details · Live account
Start now: leave your email and request a free trial — we will send the pricing, the connection route and the trial terms. Pricing
Join the market discussion: Telegram @squawklive
Source: Risk and Return
Educational content only. Trading leveraged products involves risk.
Chat with XTRSK
Chat ready
Start a chat and the XTRSK team will be notified immediately.