XCore HFT / Trading Lab
Loss limits need a hierarchy
Quantitative execution, market-microstructure, and risk-control research from XTRSK.
What this problem really is
In a prop‑trading environment the most common instinct is to protect the capital by attaching a stop to every order. The intuition is simple: if a single trade starts to move against the desk, the stop will cut the loss and the overall portfolio will be safe. In practice this intuition collapses because the stop is only a per‑order control. It does not see the aggregate exposure that builds up across strategies, across the whole account, or even across the firm’s risk budget for the day. When ten apparently independent trades all react to the same macro factor – for example a sudden widening of the EUR/USD bid‑ask spread – each trade may sit comfortably within its own per‑order limit, yet the combined realised and unrealised loss can breach the daily risk appetite in seconds. The problem is therefore not a lack of stops, but the absence of a hierarchical loss‑limit framework that integrates per‑order, per‑strategy, per‑account and firm‑wide constraints, together with realised and unrealised profit and loss, fees, financing charges and currency conversion effects.
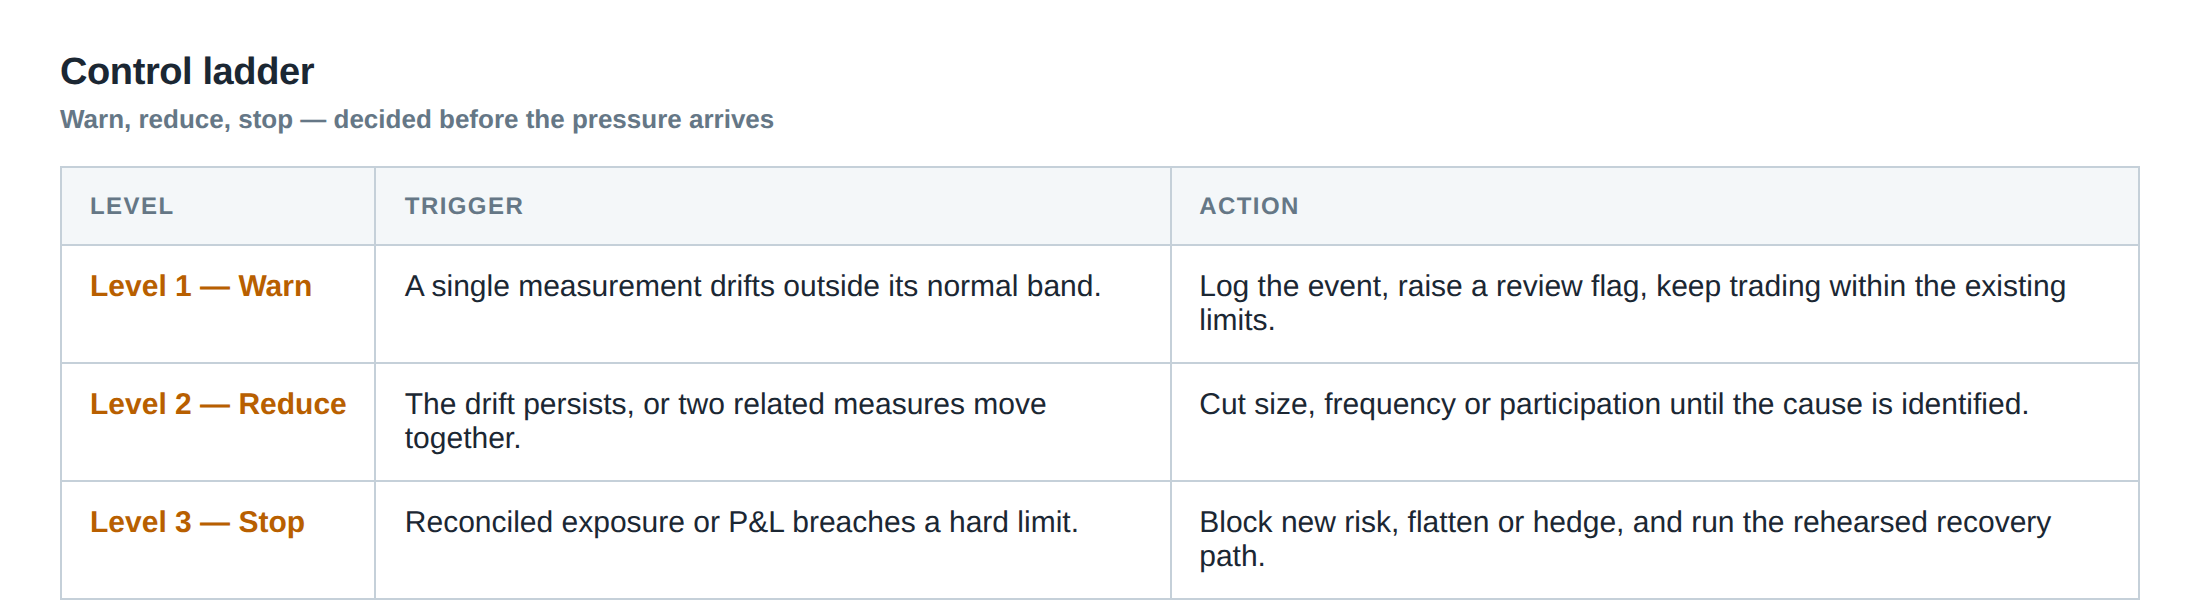
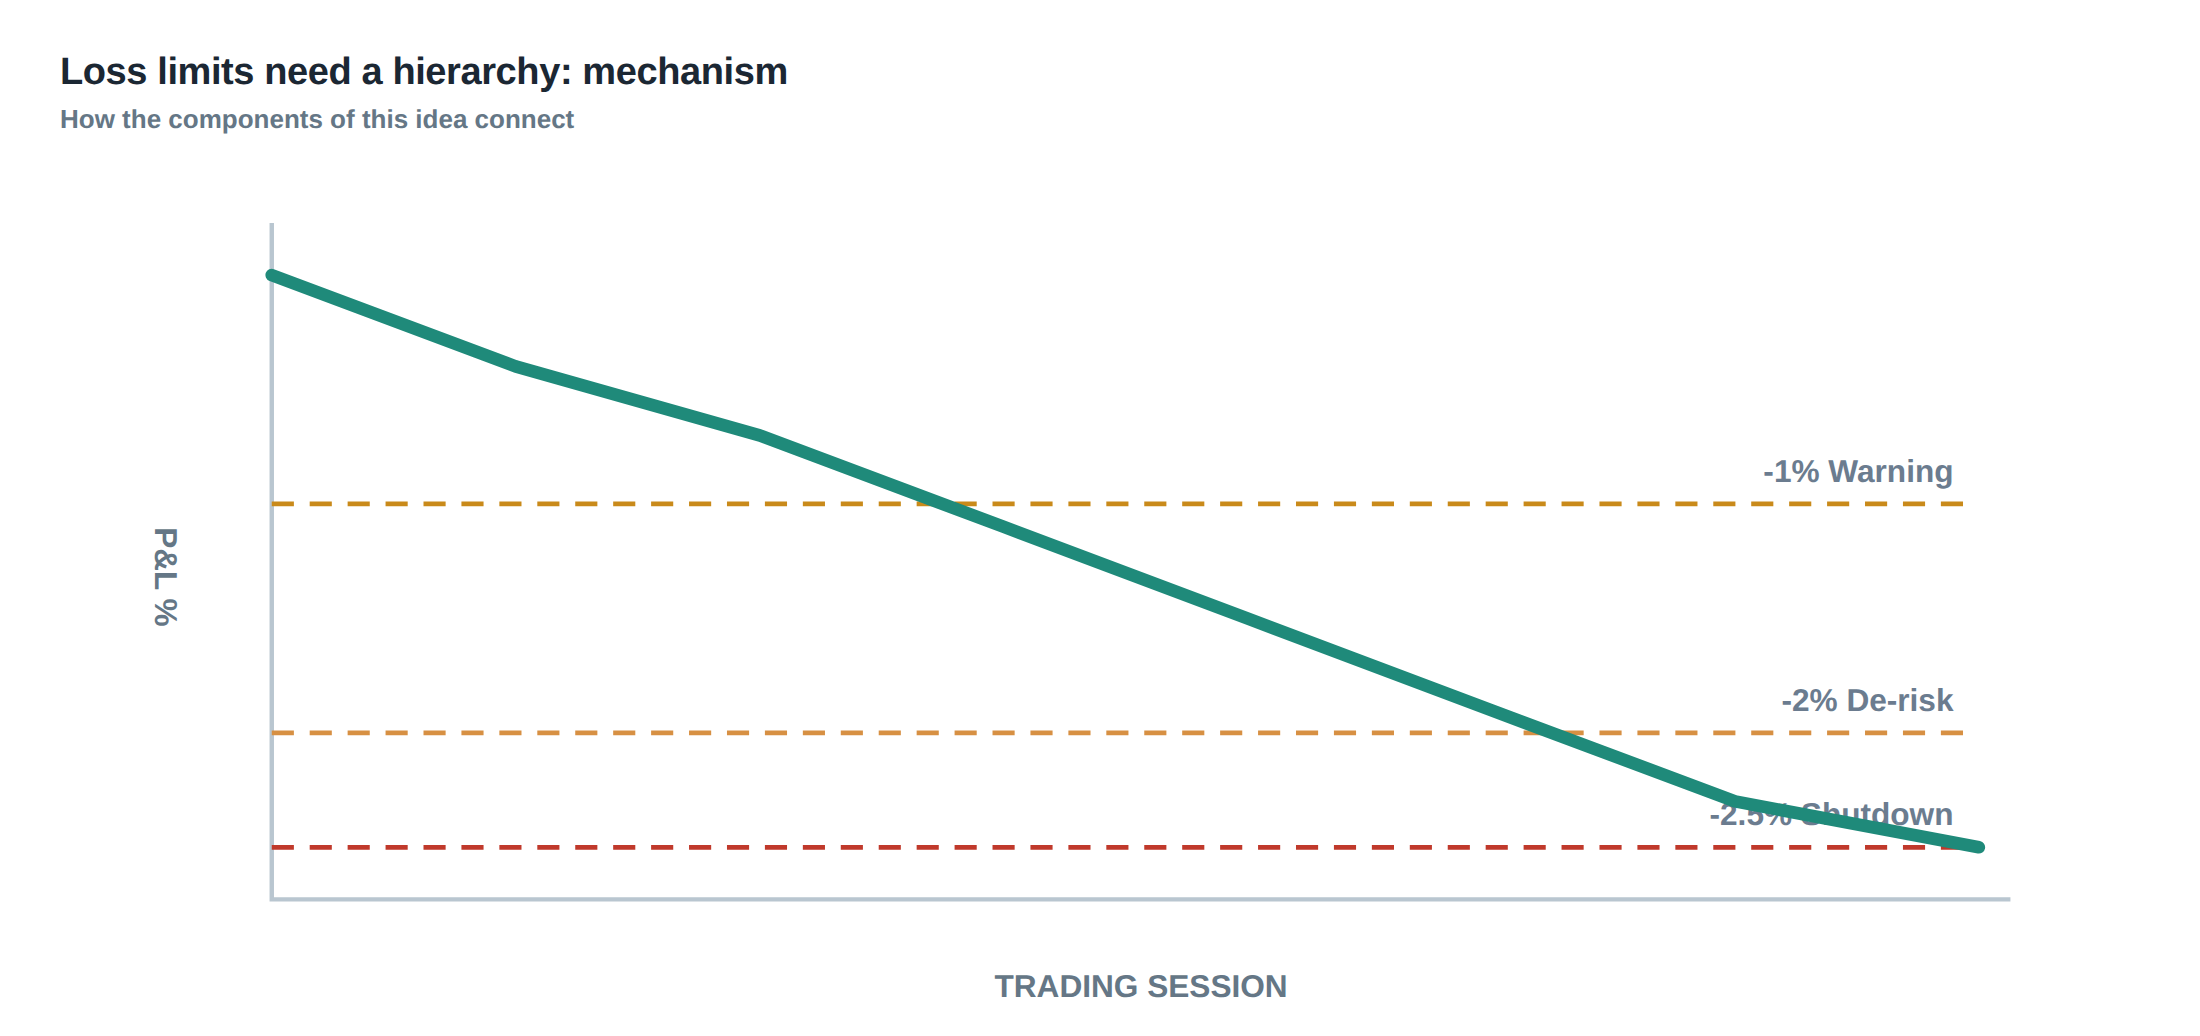
The hierarchy must also incorporate three bands – warning, reduction and shutdown – that trigger progressively harsher actions as the loss budget is approached. A warning band merely raises the monitoring frequency; a reduction band forces a reduction in order size or a tightening of per‑order stops; a shutdown band halts new order submission entirely. Crucially, the system must remember the breach even if the trading engine is automatically restarted; otherwise the budget would be reset and the desk could inadvertently re‑enter a position that should remain closed for the remainder of the day.
The research that underpins this view treats electronic markets as price‑time‑priority queues. The value of a queue position is split between the expected spread capture and the adverse‑selection cost of being filled at an unfavourable price. Holding a place in the queue also carries an option‑like value: the right to wait for a better price versus the risk that the market moves away. Consequently, an order’s lifetime cannot be judged solely by elapsed clock time; the system must continuously reassess whether the expected spread, the adverse‑selection risk and the remaining queue‑value justify keeping the order alive. This dynamic reassessment is the engine that drives the hierarchy of loss limits.
How the mechanism works, step by step
When a new order is generated the first gate is the per‑order limit. The order size, price, and the expected transaction cost (including exchange fees, clearing fees and any financing charge for leveraged positions) are compared against a pre‑set maximum loss for that single trade. If the projected loss exceeds the per‑order ceiling, the order is rejected outright.
If the order passes, the system aggregates the projected loss with the realised and unrealised P&L of the strategy that generated it. The strategy‑level limit is then evaluated. At this stage the calculation includes realised P&L from previous fills, the mark‑to‑market value of open positions, and the cost of financing any overnight exposure. For multi‑currency portfolios the mark‑to‑market values are converted at the prevailing FX rate, and the conversion cost (bid‑ask spread on the FX trade) is added to the loss estimate.
Should the strategy limit be approached, the warning band is activated: the trader receives a real‑time alert, and the algorithm tightens the per‑order stop distance by a configurable factor. If the aggregated loss breaches the reduction band, the system automatically scales down the size of any new orders from that strategy by a pre‑defined percentage and may also enforce a stricter stop‑loss distance.
Finally, the account and firm limits sit at the top of the hierarchy. The account limit aggregates the losses of all strategies running under the same capital allocation, while the firm limit aggregates across all accounts. Both limits are expressed in the base reporting currency of the firm, and they incorporate the same realised/unrealised, financing and conversion components as the lower levels. When the firm‑wide shutdown band is reached, the order gateway disables all new order entry for the remainder of the trading day, regardless of the state of any individual strategy.
The hierarchy is enforced by a central risk engine that runs on a sub‑second loop. Each loop recomputes the aggregate loss, compares it against the three bands, and issues the appropriate control signal. Because the engine stores the last breach timestamp, an automatic restart of the order gateway does not clear the breach flag; the shutdown persists until the daily budget is manually reset after the market close.
A worked example with real numbers
Consider a desk that trades ten statistical‑arbitrage pairs on EUR/USD, each with a per‑order loss limit of €5 000. The daily strategy risk appetite for the whole set is €30 000, the account limit is €80 000 and the firm‑wide limit is €150 000. All ten trades are entered at 09:30 GMT with an initial expected loss of €3 000 each, comfortably under the per‑order ceiling.
At 09:45 GMT a sudden macro announcement widens the EUR/USD spread by 2 pips and introduces a 1 % adverse‑selection cost on all pending orders. The realised loss on each filled leg becomes €7 000, and the unrealised mark‑to‑market loss on the remaining legs rises to €6 500. Fees amount to €150 per trade, financing for the leveraged positions adds €200, and the conversion from USD‑denominated P&L to the reporting currency (EUR) incurs a spread cost of €100 per trade. The total loss per trade therefore equals €7 000 + €6 500 + €150 + €200 + €100 = €14 950.
Individually each trade still respects the per‑order limit because the limit is applied to the projected loss at order entry, not to the realised loss after execution. However, the aggregated loss across the ten trades is €149 500, which exceeds the daily strategy limit (€30 000) and also breaches the account limit (€80 000). The risk engine therefore moves the hierarchy through its bands: the warning band is triggered at €30 000, the reduction band at €70 000, and the shutdown band at €80 000. At €70 000 the system halves the size of any new orders from the strategy and tightens the stop distance by 30 %. At €80 000 the engine issues a shutdown command that disables all further order entry for the desk for the rest of the day.
Because the breach flag is stored in persistent memory, a subsequent automatic restart of the order gateway at 10:15 GMT does not clear the shutdown state. The desk must manually acknowledge the breach and wait until the daily budget is cleared after the market close before trading can resume.
Where it breaks in live markets
Even with a hierarchical framework, implementation gaps appear when market conditions evolve faster than the risk engine’s refresh cycle. In ultra‑low‑latency environments a sudden flash crash can generate dozens of fills within a few milliseconds, outrunning the sub‑second loop and allowing the aggregate loss to exceed the shutdown band before the engine can intervene.
Another failure mode is the neglect of currency conversion lag. If the risk engine uses end‑of‑minute FX rates while the portfolio holds positions that are marked‑to‑market on a tick‑by‑tick basis, the conversion component of the loss can be understated, delaying the activation of the reduction band.
A third source of breakdown is the assumption that fees and financing are static. In reality, clearing fees can surge when market volatility spikes, and overnight financing rates can change intra‑day for certain instruments. If the risk engine does not ingest these dynamic components, the loss estimate will be stale and the hierarchy will not fire at the intended thresholds.
Finally, many desks rely on manual overrides to “reset” a breach after a restart. This practice defeats the purpose of the shutdown band, because it effectively gives the system a fresh budget mid‑day, opening the door to repeat breaches.
The operating path, stage by stage
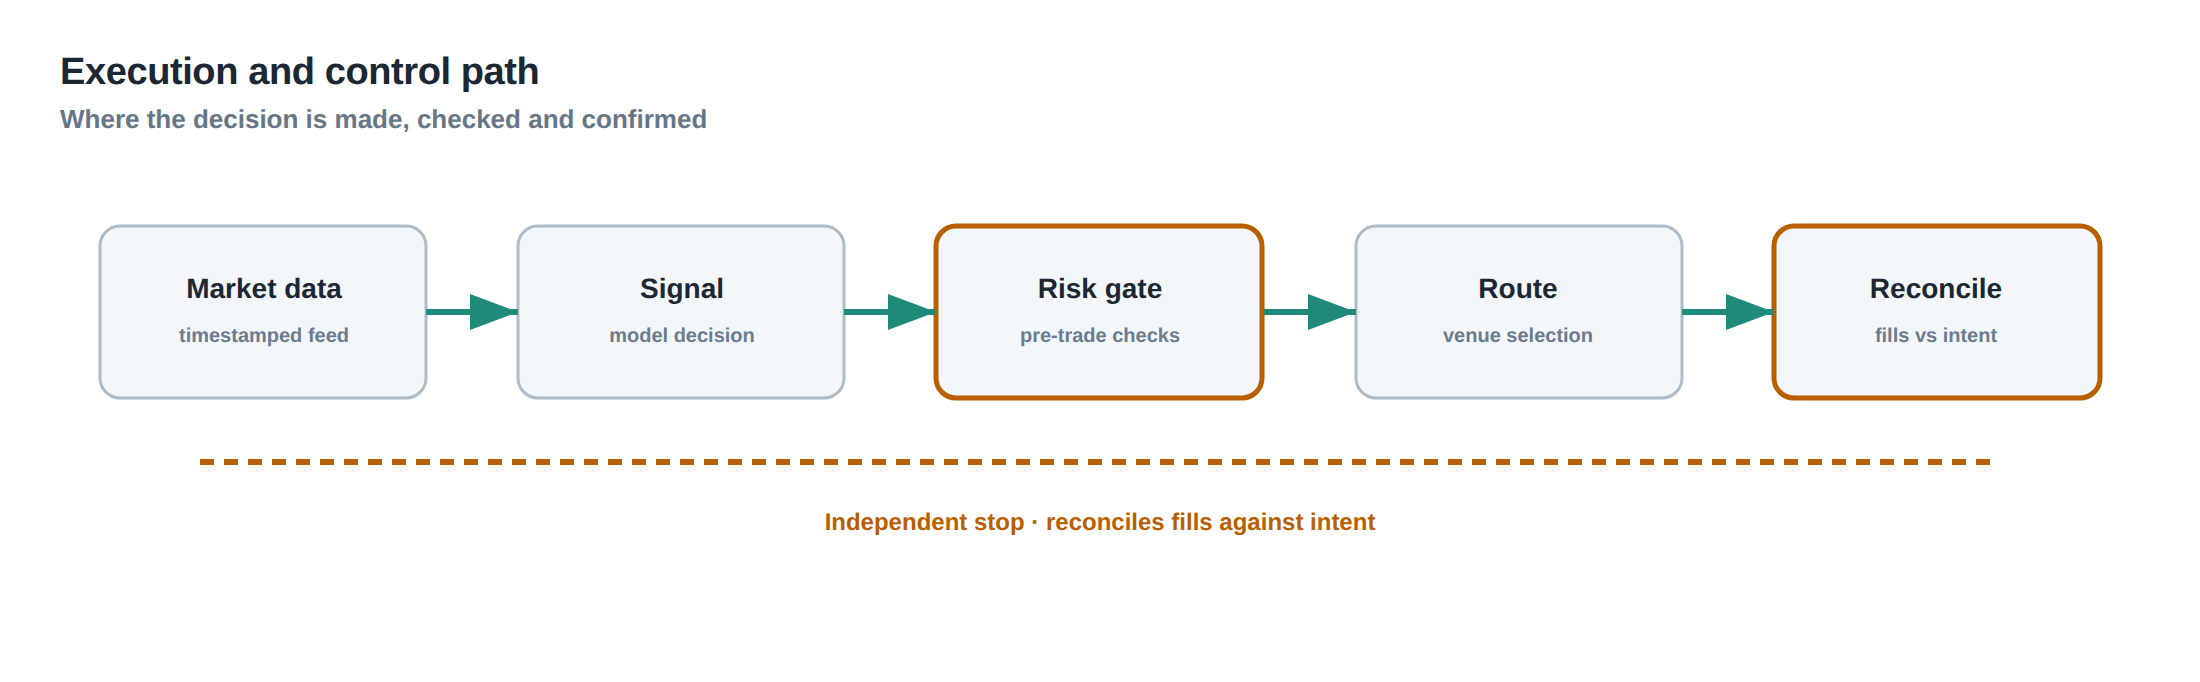
The first stage is order creation. The trader or algorithm supplies the desired size, price, and side, together with an estimate of the transaction cost. The per‑order validator checks this estimate against the per‑order loss ceiling, adding fees, financing and any expected conversion cost.
The second stage is strategy aggregation. The risk engine pulls the realised P&L from the trade blotter, marks the open positions to market, and converts all figures into the strategy’s reporting currency. It then adds the projected loss of the new order to this total and compares the sum with the warning, reduction and shutdown bands for the strategy.
The third stage is account consolidation. The engine repeats the aggregation across all strategies belonging to the same capital allocation, again applying the three bands.
The fourth stage is firm‑wide synthesis. Here the totals from all accounts are summed, converted to the firm’s base currency, and the same band logic is applied.
At each stage, if a band is crossed, a control signal is emitted: an alert, a size‑reduction command, or a hard shutdown. The signals propagate downstream to the order gateway, which enforces them in real time. The engine logs the breach timestamp and sets a persistent flag that survives any process restart.
Controls that act before the damage
Pre‑emptive controls sit at the per‑order level but are informed by higher‑level risk parameters. For example, the per‑order stop distance can be dynamically widened if the strategy is already close to its reduction band, reducing the probability of a fill that would push the strategy into the shutdown band.
A ladder of stop‑loss adjustments can be programmed: the first rung tightens the stop by 10 %, the second by 25 %, and the third by 50 %, each rung triggered as the aggregated loss climbs through the warning and reduction bands.
Another pre‑damage control is order throttling. When the risk engine detects that the firm‑wide warning band has been breached, it can limit the number of new orders per second, giving the market more time to absorb existing positions before additional exposure is added.
Finally, budget‑aware order sizing ensures that the expected loss of a new order cannot exceed the remaining allowance in the daily budget. The order size is automatically scaled down so that the sum of projected losses never surpasses the shutdown threshold, even before the order reaches the market.
How to measure whether it is working
The primary metric is the budget utilisation ratio: realised plus unrealised loss divided by the daily budget, measured at the strategy, account and firm levels. A healthy system keeps this ratio well below the shutdown band for the majority of trading days, with occasional excursions into the reduction band that are promptly corrected.
Secondary metrics include the time‑to‑band – the elapsed time between the first breach of a band and the activation of the corresponding control. In a robust implementation this latency should be measured in milliseconds, not seconds.
A third indicator is the restart‑persistence rate: the proportion of breaches that survive an automatic gateway restart. This should be 100 % if the persistent flag is correctly implemented.
Finally, the false‑positive rate – the frequency with which a control is triggered but the subsequent loss trajectory would have remained within the budget – should be monitored. Excessive false positives indicate that the band thresholds are set too conservatively, eroding trading efficiency.
The portfolio view
From the portfolio perspective the hierarchy of loss limits creates a coherent risk envelope that aligns individual trade decisions with the desk’s overall risk appetite. Each trade is evaluated not only on its own merit but also on its marginal contribution to the aggregate exposure.
When a market factor – such as a sudden shift in the EUR/USD spread – moves multiple correlated positions in the same direction, the portfolio‑level view recognises the concentration risk that per‑order stops alone cannot see. The reduction and shutdown bands act as a safety net that forces the desk to either unwind the correlated positions or to tighten the risk parameters for the remainder of the day.
Because the hierarchy integrates fees, financing and currency conversion, the portfolio P&L reflects the true economic cost of the trading activity. This prevents the illusion of profitability that can arise when only realised cash flows are considered, ignoring the hidden drag of financing and conversion spreads.
In practice, the portfolio view also informs capital allocation. Strategies that consistently operate close to their reduction band may be allocated a smaller capital slice, while those that stay comfortably within their warning band can be granted a larger budget. The hierarchy therefore becomes a feedback loop that not only protects capital but also guides strategic growth.
Is your current loss‑limit framework able to stop a cascade of ten seemingly independent trades from breaching the daily risk appetite, or does it rely solely on per‑order stops?
About the research behind this lesson
The seminar frames electronic markets as price-time-priority queues. It separates queue value into spread capture versus adverse-selection cost and the option value of retaining a place in line.
Applied to this lesson: An order lifetime therefore cannot be based on elapsed time alone: the system must reassess whether its queue position, expected spread and adverse-selection risk still justify keeping the order alive.
Two live systems, one desk
PULSE-X — power-packed HFT: high-frequency momentum on XAUUSD and EURUSD. System details · Live account
NIC-X — ultra-low drawdown: displaced-print arbitrage for large capital. System details · Live account
Start now: leave your email and request a free trial — we will send the pricing, the connection route and the trial terms. Pricing
Live chat and updates: Telegram @xtrskhft
Source: High-Frequency Trading and Modern Market Microstructure
Educational content only. Trading leveraged products involves risk.
Chat with XTRSK
Chat ready
Start a chat and the XTRSK team will be notified immediately.